Free Access
Fig. 9
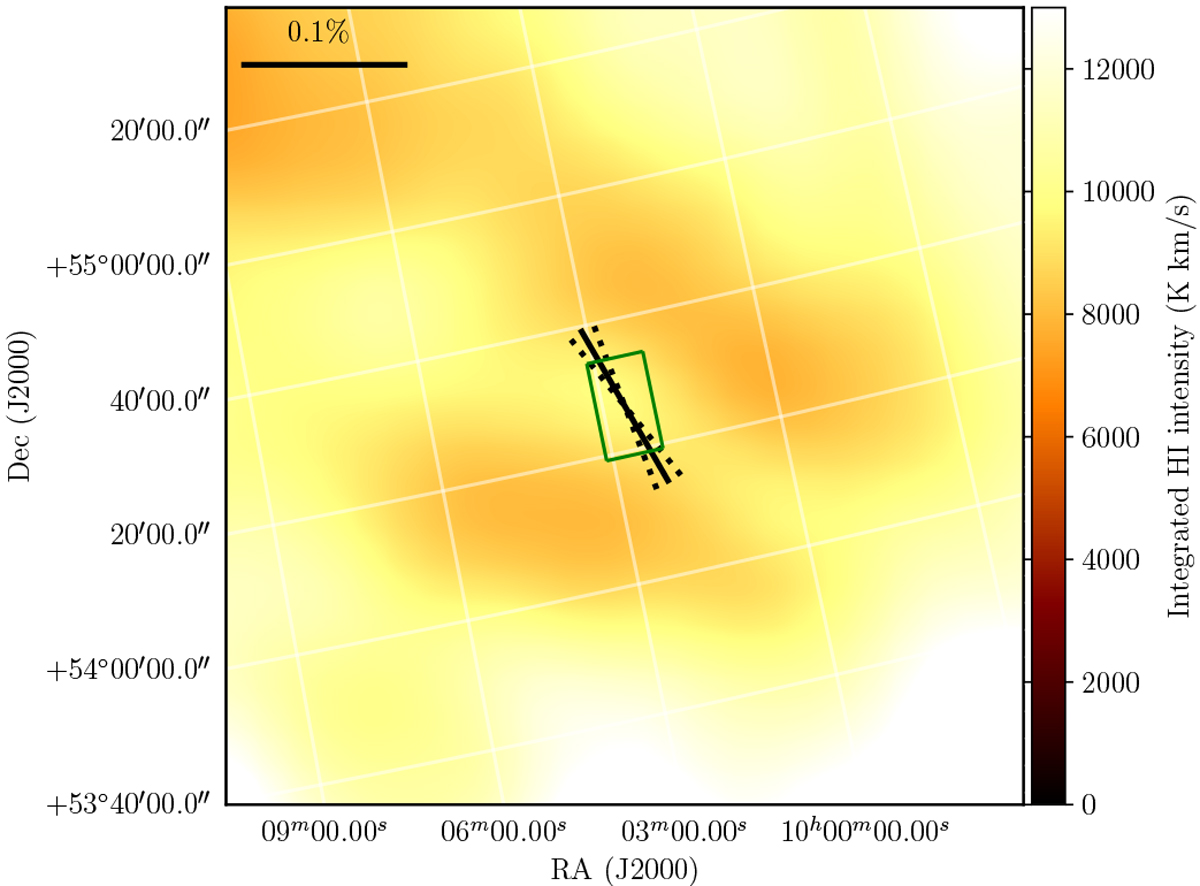
Mean polarization orientation over-plotted on an image of HI integrated intensity centered on DP2. Velocities are integrated around –9 km s−1. The green box marks the surveyed region. The segment in the top-left corner is for scale in p.
Current usage metrics show cumulative count of Article Views (full-text article views including HTML views, PDF and ePub downloads, according to the available data) and Abstracts Views on Vision4Press platform.
Data correspond to usage on the plateform after 2015. The current usage metrics is available 48-96 hours after online publication and is updated daily on week days.
Initial download of the metrics may take a while.