Fig. 11
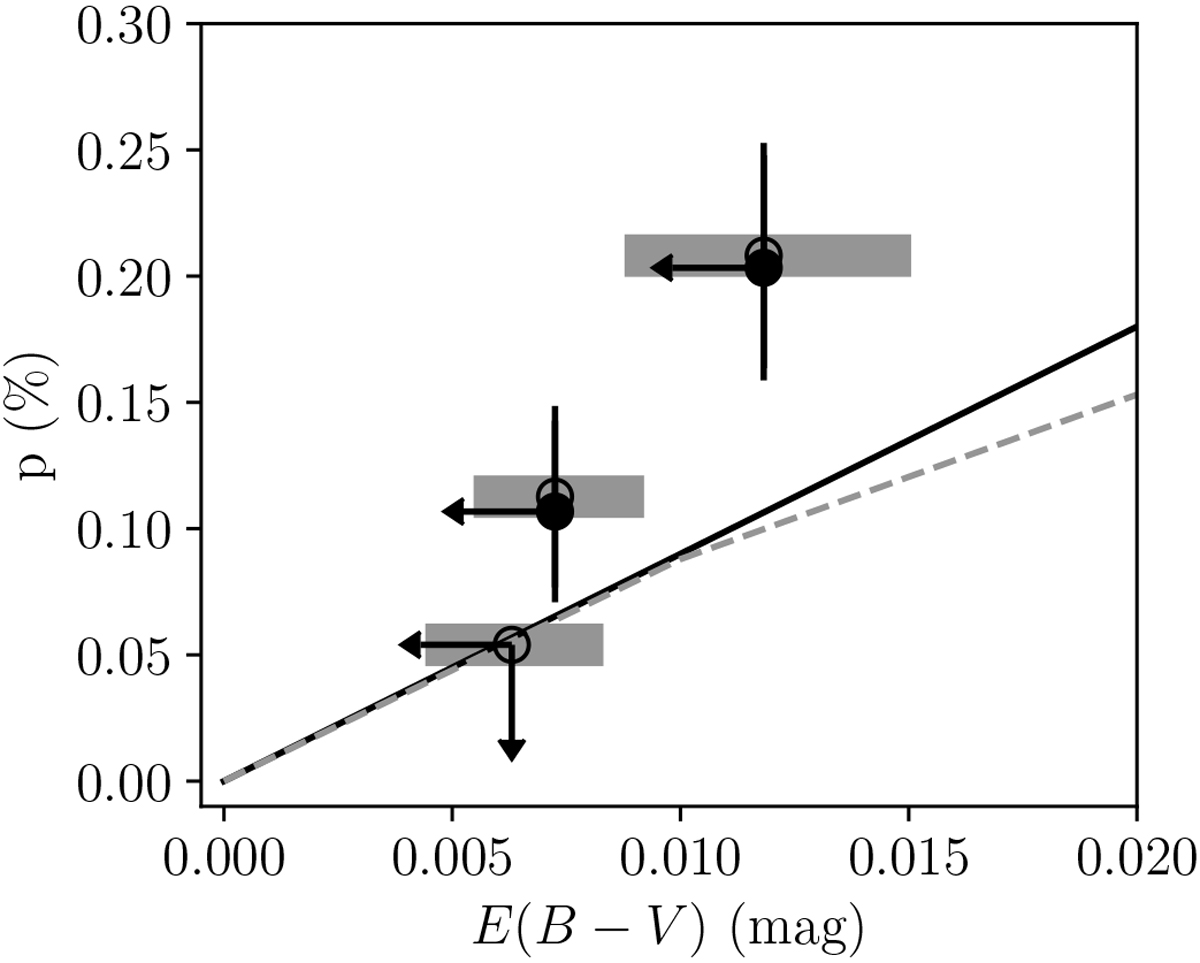
Fractional linear polarization vs. reddening. Open circles show the pmean of the DPs, while filled circles show the debiased ![]() (Table 3). The E(B–V) is found from the LHD map as explained in the text. The solid black line indicates the upper envelope from Eq. (5) (Hiltner 1956). The expression for the mean p, Eq. (6) (Fosalba et al. 2002), is traced by the dashed gray line. The gray regions indicate the interval in which E(B–V) values lie within 99% confidence.
(Table 3). The E(B–V) is found from the LHD map as explained in the text. The solid black line indicates the upper envelope from Eq. (5) (Hiltner 1956). The expression for the mean p, Eq. (6) (Fosalba et al. 2002), is traced by the dashed gray line. The gray regions indicate the interval in which E(B–V) values lie within 99% confidence.
Current usage metrics show cumulative count of Article Views (full-text article views including HTML views, PDF and ePub downloads, according to the available data) and Abstracts Views on Vision4Press platform.
Data correspond to usage on the plateform after 2015. The current usage metrics is available 48-96 hours after online publication and is updated daily on week days.
Initial download of the metrics may take a while.