Fig. 15
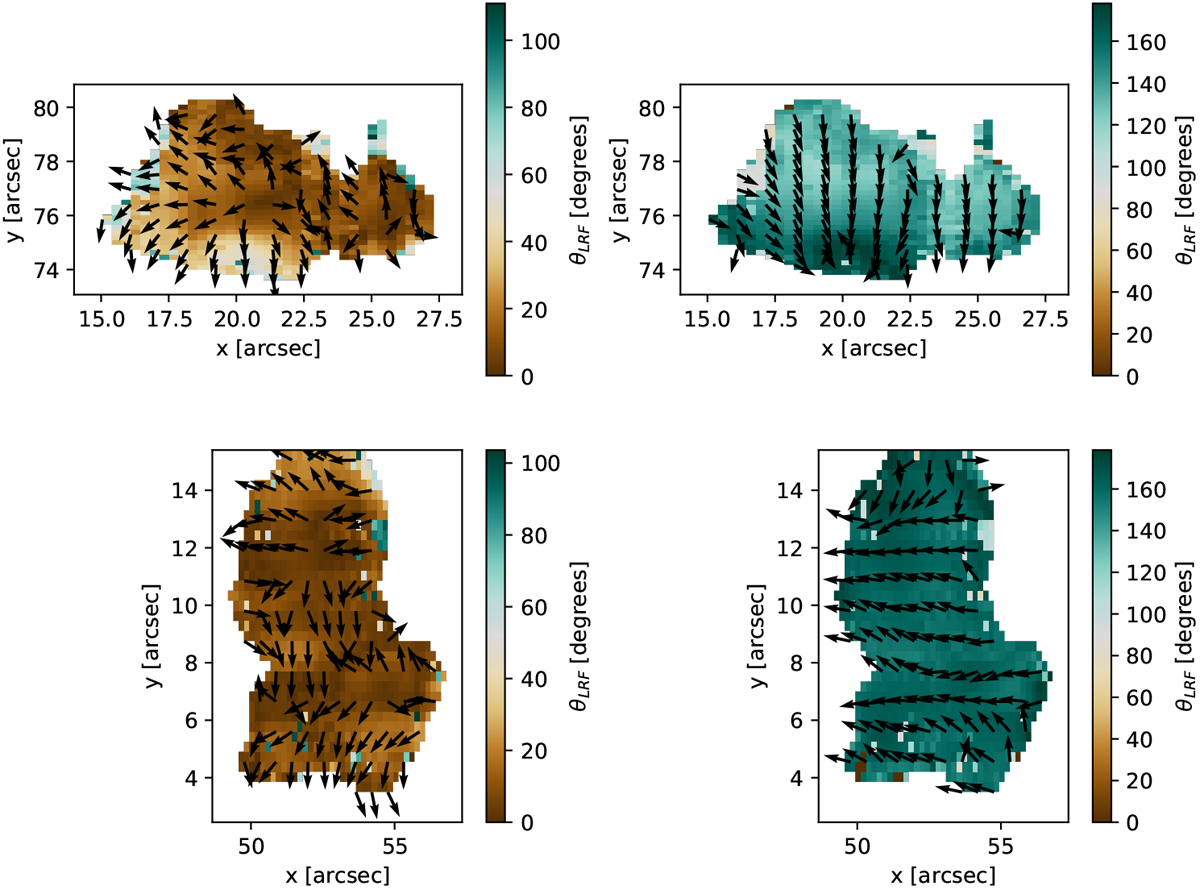
LRF magnetic topology of two magnetic patches extracted from limb datasets. From top to bottom: two structures taken from the north region dataset and from the west region, respectively. The magnetic field inclination is colour-scaled. Arrows show the magnetic field azimuth. Arrows are plotted for one of every three pixels in each direction for clarity. Each column represents one of the two possible solutions retrieved due to the LOS magnetic field azimuth 180° ambiguity.
Current usage metrics show cumulative count of Article Views (full-text article views including HTML views, PDF and ePub downloads, according to the available data) and Abstracts Views on Vision4Press platform.
Data correspond to usage on the plateform after 2015. The current usage metrics is available 48-96 hours after online publication and is updated daily on week days.
Initial download of the metrics may take a while.