Fig. 14
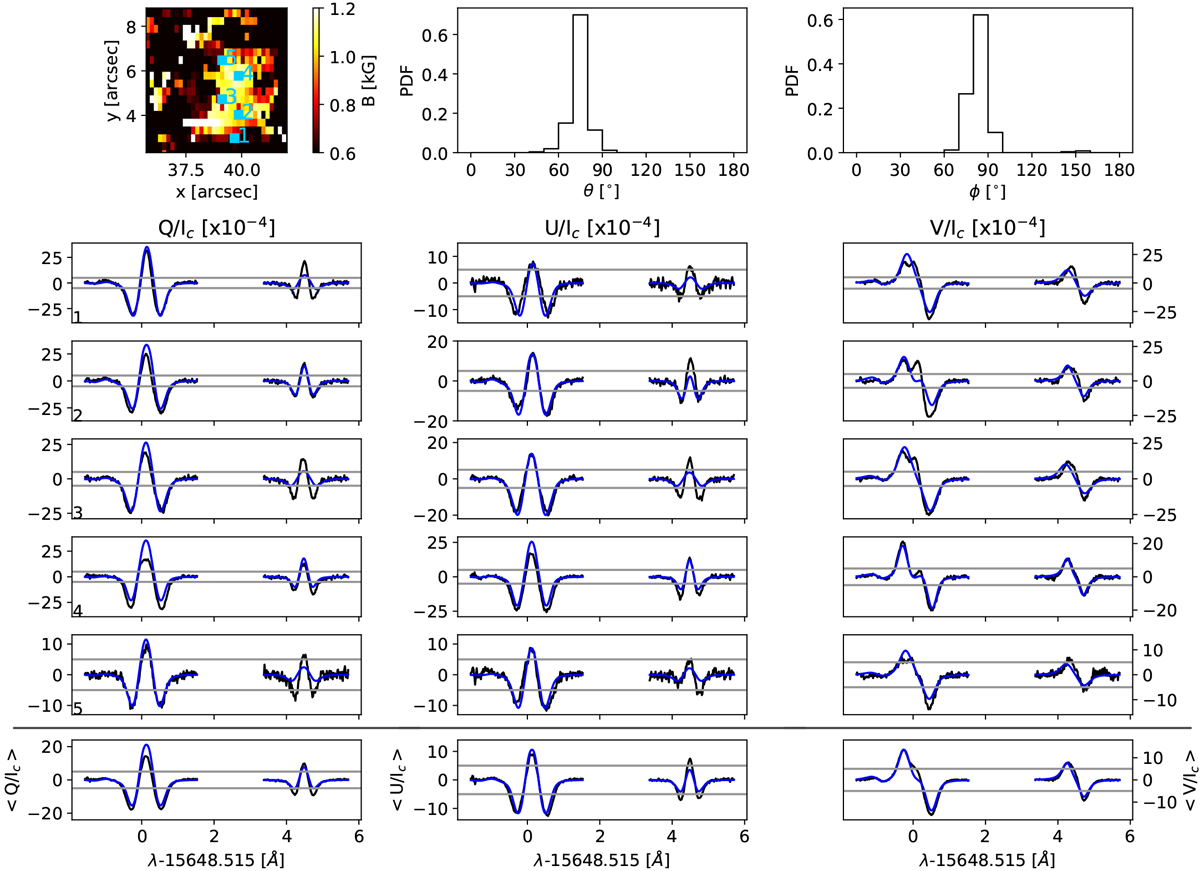
Different parameters found for a kG magnetic field structure observed in the west dataset. Top row, from left to right: magnetic field intensity map, the probability density function of the LOS magnetic field inclination, and the LOS magnetic field azimuth probability density function. The panels below, from left to right, show the Stokes Q, U, and V observed profiles (dark line) and inversions (blue lines) for the various pixels highlighted in the image. The bottom row shows the observed (black) and inverted (blue) profiles averaged over the whole structure. The grey horizontal lines represent the ± 5σ levels.
Current usage metrics show cumulative count of Article Views (full-text article views including HTML views, PDF and ePub downloads, according to the available data) and Abstracts Views on Vision4Press platform.
Data correspond to usage on the plateform after 2015. The current usage metrics is available 48-96 hours after online publication and is updated daily on week days.
Initial download of the metrics may take a while.