Fig. 1
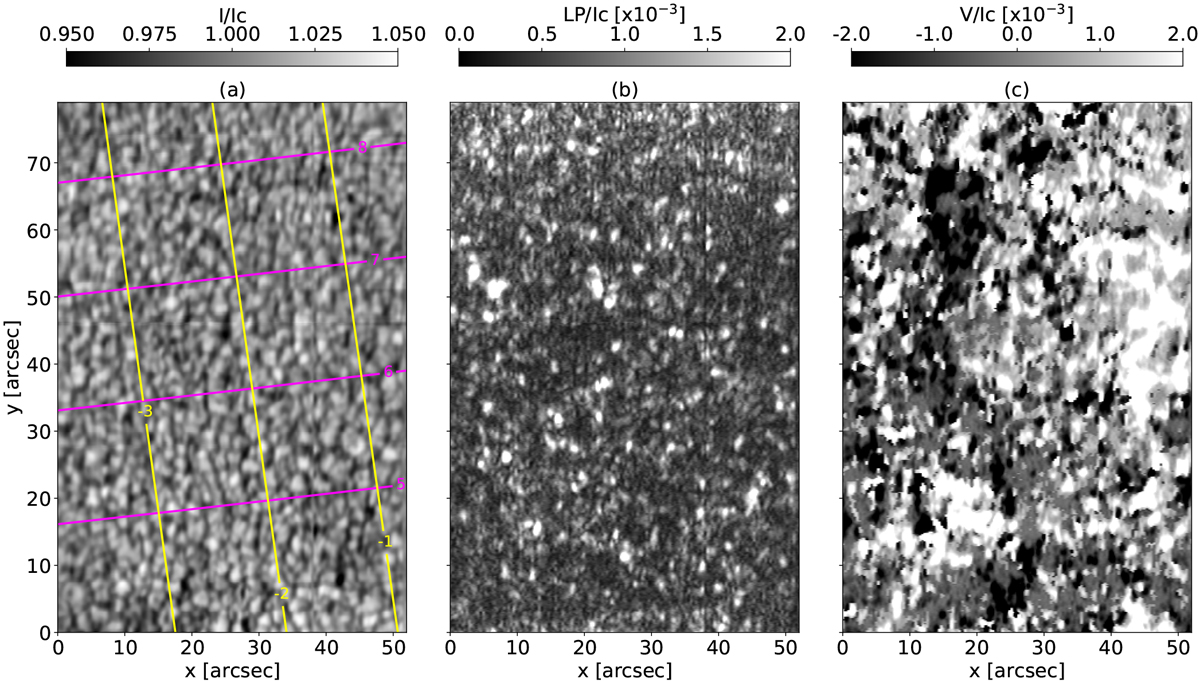
Intensity and polarisation maps for the disc centre dataset. Panel a: continuum intensity map normalisedto the average continuum intensity. Magenta and yellow lines mark the solar latitude and longitude, respectively. The x- and y-axes show the observed distance on the solar disc in arcseconds. Ic is the average continuum intensity of disc centre quiet Sun. Panel b: map of the maximum linear polarisation signals at the blue wing of the 15 648.5 Å spectral line (given by ![]() ). Panel c: map of the maximum amplitude Stokes V at the blue wing of the 15 648.5 Å spectral line.
). Panel c: map of the maximum amplitude Stokes V at the blue wing of the 15 648.5 Å spectral line.
Current usage metrics show cumulative count of Article Views (full-text article views including HTML views, PDF and ePub downloads, according to the available data) and Abstracts Views on Vision4Press platform.
Data correspond to usage on the plateform after 2015. The current usage metrics is available 48-96 hours after online publication and is updated daily on week days.
Initial download of the metrics may take a while.