Free Access
Fig. 5.
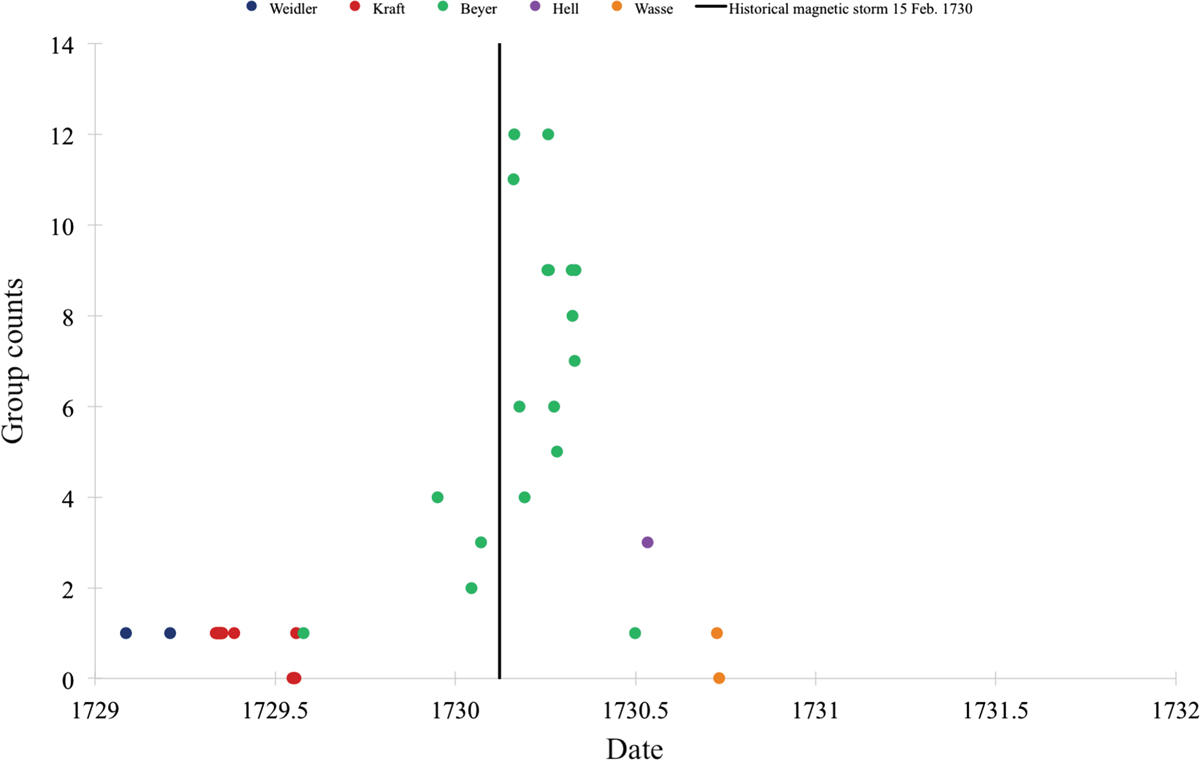
Sunspot group counts from 1729 to 1731, based on Table 2. Blue, red, green, purple, and orange represent the solar observations made by Weidler, Kraft, Beyer, Hell, and Wasse, respectively. The vertical black line depicts the date when a historical storm studied in this work occurred (February 15, 1730).
Current usage metrics show cumulative count of Article Views (full-text article views including HTML views, PDF and ePub downloads, according to the available data) and Abstracts Views on Vision4Press platform.
Data correspond to usage on the plateform after 2015. The current usage metrics is available 48-96 hours after online publication and is updated daily on week days.
Initial download of the metrics may take a while.