Free Access
Fig. 1
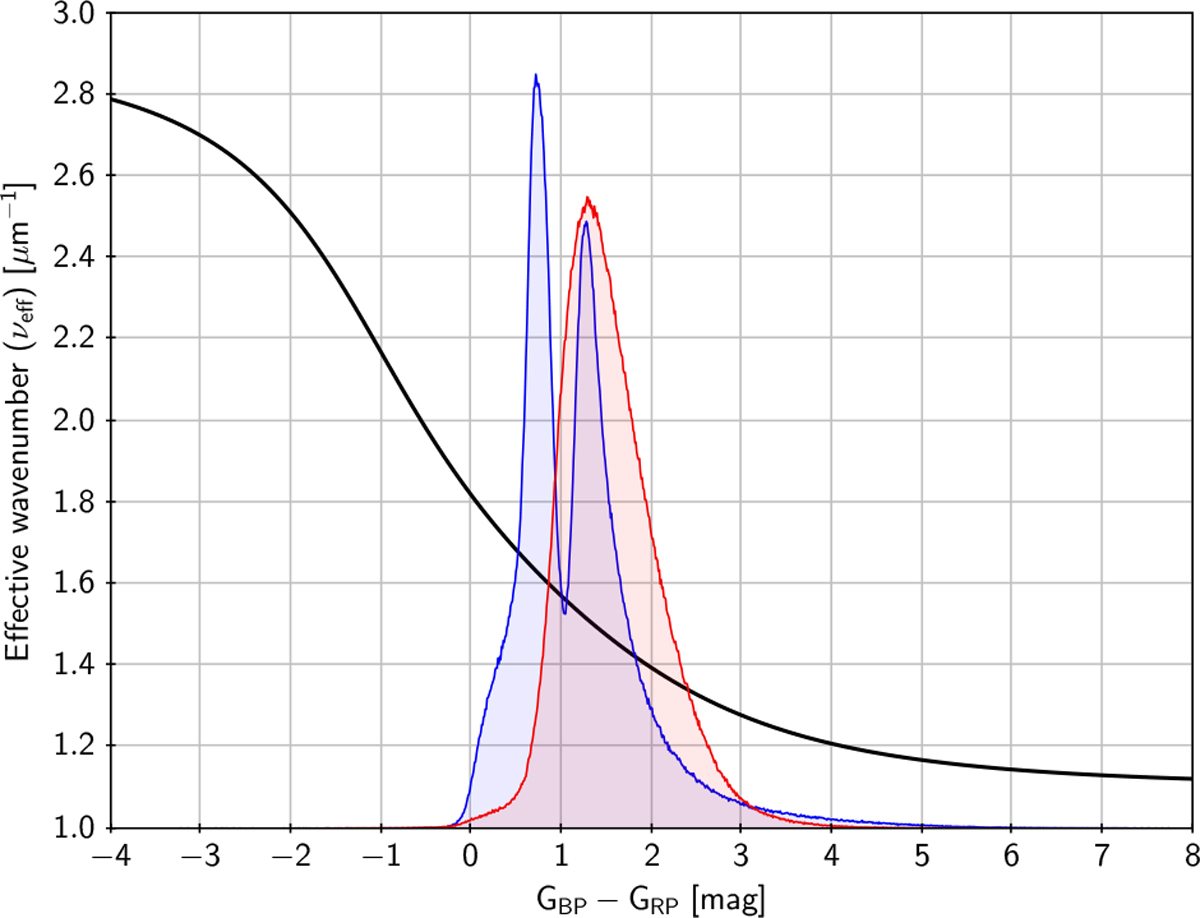
Effective wavenumber as a function of colour index. The curve is the analytical relation in Eq. (2). We also show the distribution of GBP –GRP for a randomselection of bright (G < 12 mag, bluish histogram with two peaks) and faint (G > 18 mag, reddish histogram) sources.
Current usage metrics show cumulative count of Article Views (full-text article views including HTML views, PDF and ePub downloads, according to the available data) and Abstracts Views on Vision4Press platform.
Data correspond to usage on the plateform after 2015. The current usage metrics is available 48-96 hours after online publication and is updated daily on week days.
Initial download of the metrics may take a while.