Fig. 3
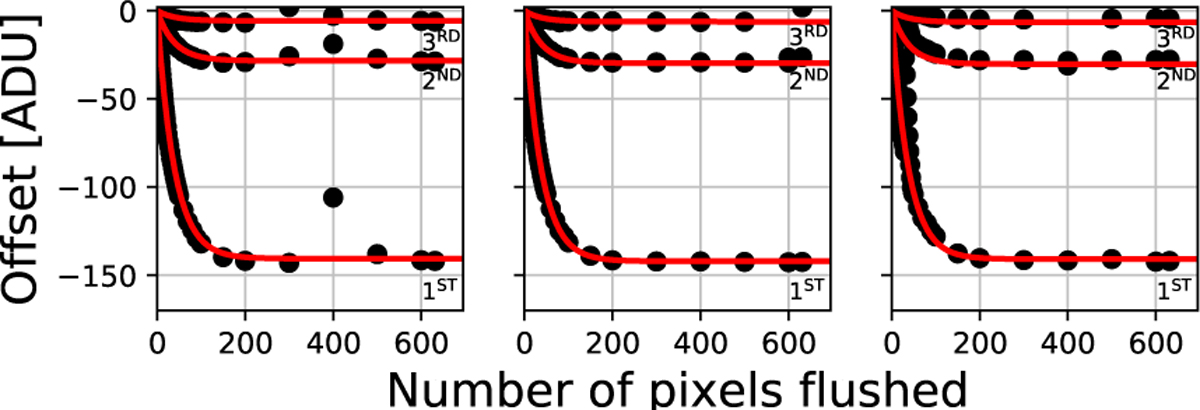
Black dots in each panel show the excursion in bias level measured on-ground in an RVS test device for the first, second, and third pixels after the flush/read transition as a function of the number of flushes beforehand. Red lines show fitted analytical calibration functions for each of the three pixels. Each panel presents a different pattern of flushes. The saturation effect after a large number of flushes is evident, as is the rapid recovery in the subsequent read pixels after the first (each of the three red lines). The data shown in the panel on the left also show the perturbation resulting from a glitch after a pause in the serial readout (see text). Figure adapted from Boudreault & Cropper (2011a).
Current usage metrics show cumulative count of Article Views (full-text article views including HTML views, PDF and ePub downloads, according to the available data) and Abstracts Views on Vision4Press platform.
Data correspond to usage on the plateform after 2015. The current usage metrics is available 48-96 hours after online publication and is updated daily on week days.
Initial download of the metrics may take a while.