Fig. 26
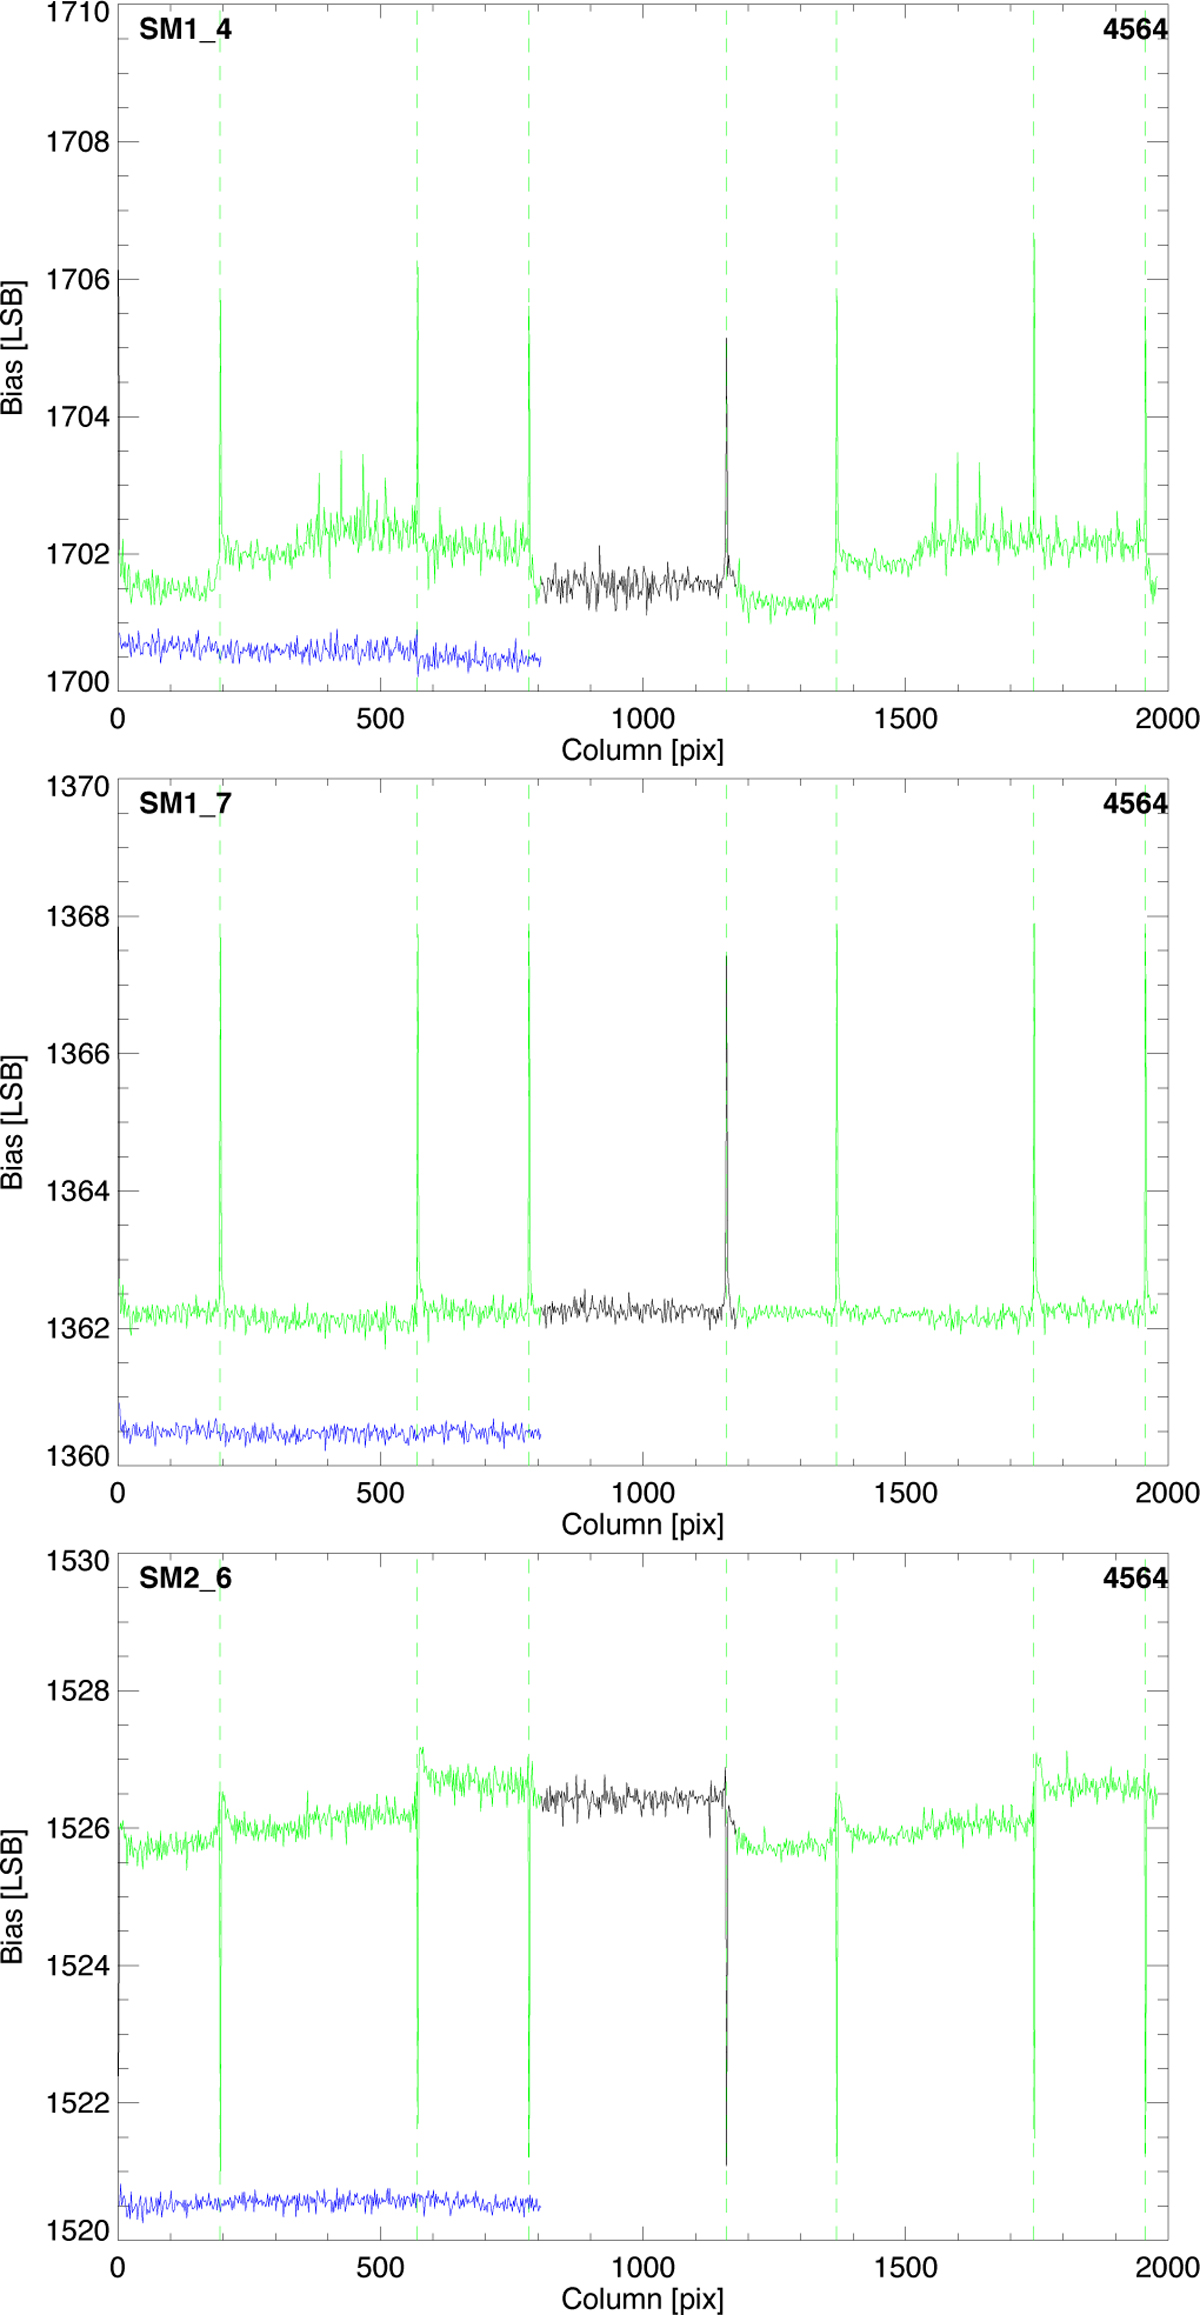
Bias for three SM devices (from top to bottom: SM1 in row 4, SM1 in row 7 and SM2 in row 6) from a calibration run in December 2016. The two green segments of the bias-curves are read in the same phase within a TDI period. The blue curve, with a small offset, shows the difference between the two green sections divided by square root 2. The vertical dashed green lines indicate the readout freezes.
Current usage metrics show cumulative count of Article Views (full-text article views including HTML views, PDF and ePub downloads, according to the available data) and Abstracts Views on Vision4Press platform.
Data correspond to usage on the plateform after 2015. The current usage metrics is available 48-96 hours after online publication and is updated daily on week days.
Initial download of the metrics may take a while.