Free Access
Fig. 15
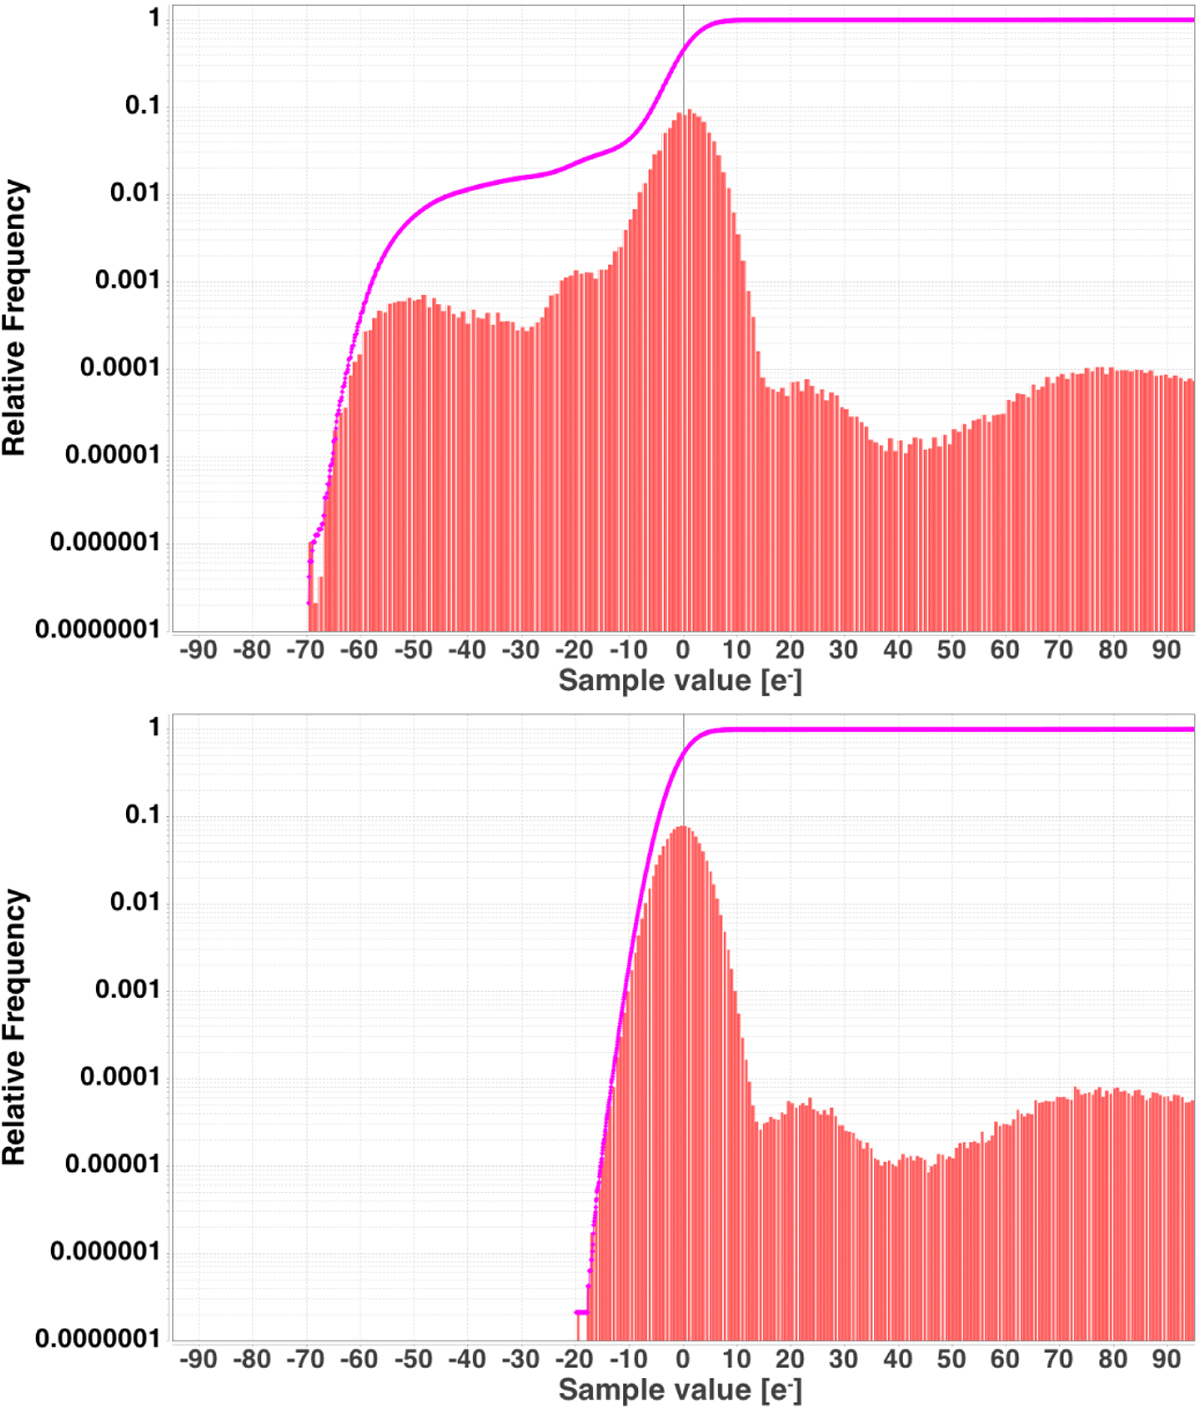
Sample distribution in the calibration data for RVS3 in row 6, strip 17 before (above) and after (below) calibration (from the same data) and removal of the calibrated offset excursions. Red bars are histogram counts, while the magenta line shows the cumulative count across the distribution.
Current usage metrics show cumulative count of Article Views (full-text article views including HTML views, PDF and ePub downloads, according to the available data) and Abstracts Views on Vision4Press platform.
Data correspond to usage on the plateform after 2015. The current usage metrics is available 48-96 hours after online publication and is updated daily on week days.
Initial download of the metrics may take a while.