Fig. 12
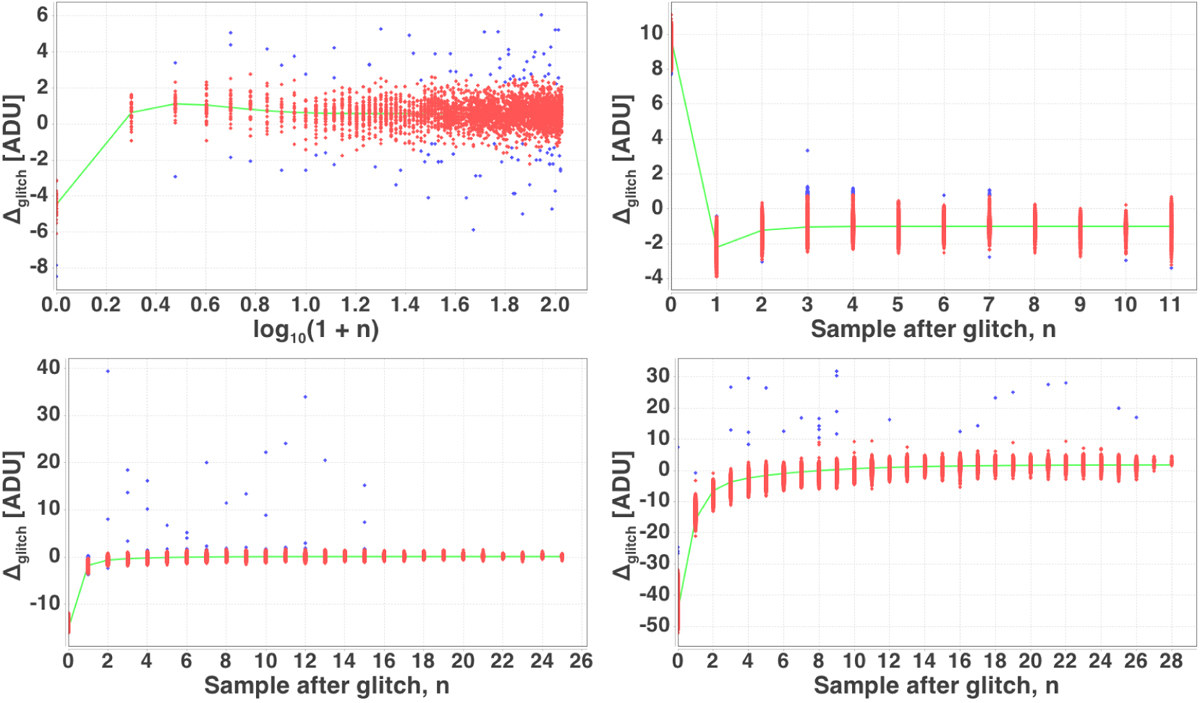
Example glitch model fits for four components out of all those plotted in Fig. 11: glitch 6 in SM2 in row 6 (upper left); glitch 2 in AF3 in row 5 (upper right); glitch 3 in RP in row 3 (lower left); and glitch 3 in RVS3 in row 5, strip 17 (lower right). In all cases, red points show calibration data, blue points are outlying data rejected in the iterativelinear least-squares fitting procedure, and the green line shows the fitted model.
Current usage metrics show cumulative count of Article Views (full-text article views including HTML views, PDF and ePub downloads, according to the available data) and Abstracts Views on Vision4Press platform.
Data correspond to usage on the plateform after 2015. The current usage metrics is available 48-96 hours after online publication and is updated daily on week days.
Initial download of the metrics may take a while.