Fig. 6.
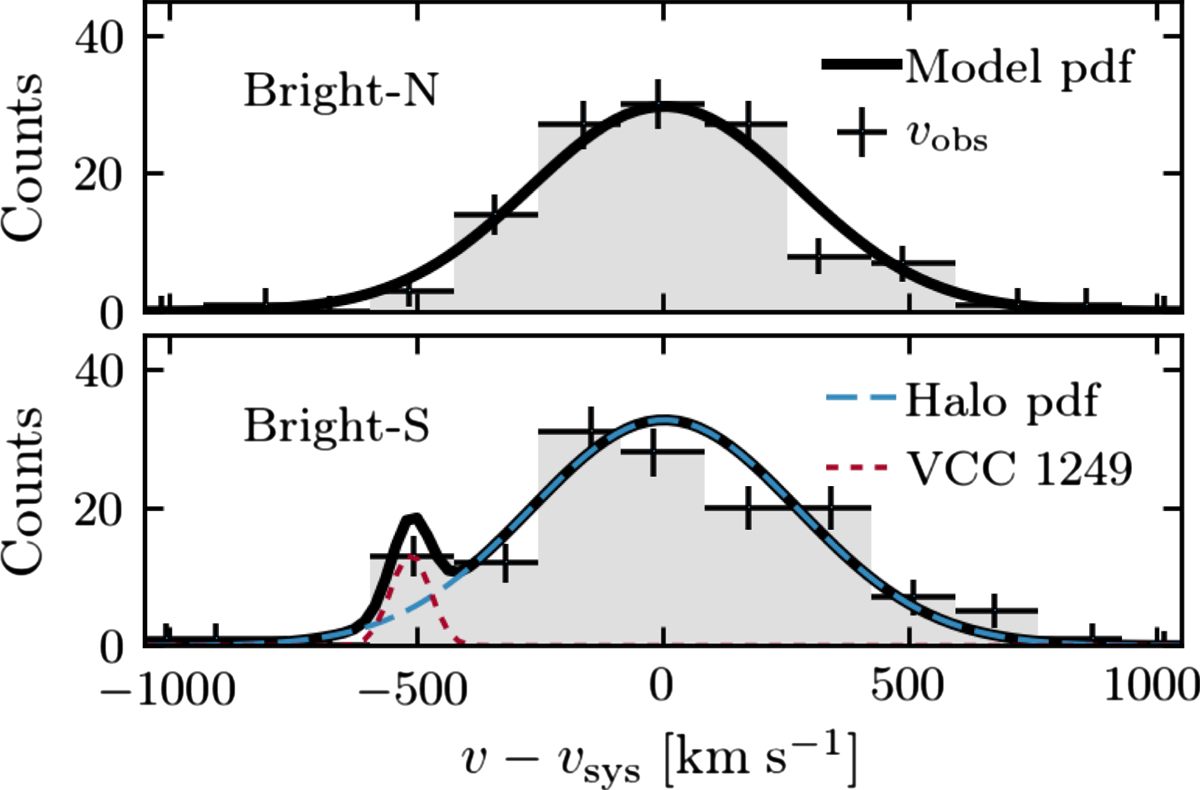
LOSVD of the bright component (grey histogram with errorbars) in the north (top) and south (bottom) of the galaxy. The northern component is best-fit by a single Gaussian (solid black line). The substructure of VCC 1249 in the southern part is fit by a Gaussian (dotted red line) in addition to the halo (dashed blue line). While the likelihood is fit with a bin-free method, we bin the LOSVDs for visual convenience.
Current usage metrics show cumulative count of Article Views (full-text article views including HTML views, PDF and ePub downloads, according to the available data) and Abstracts Views on Vision4Press platform.
Data correspond to usage on the plateform after 2015. The current usage metrics is available 48-96 hours after online publication and is updated daily on week days.
Initial download of the metrics may take a while.