Free Access
Fig. 5.
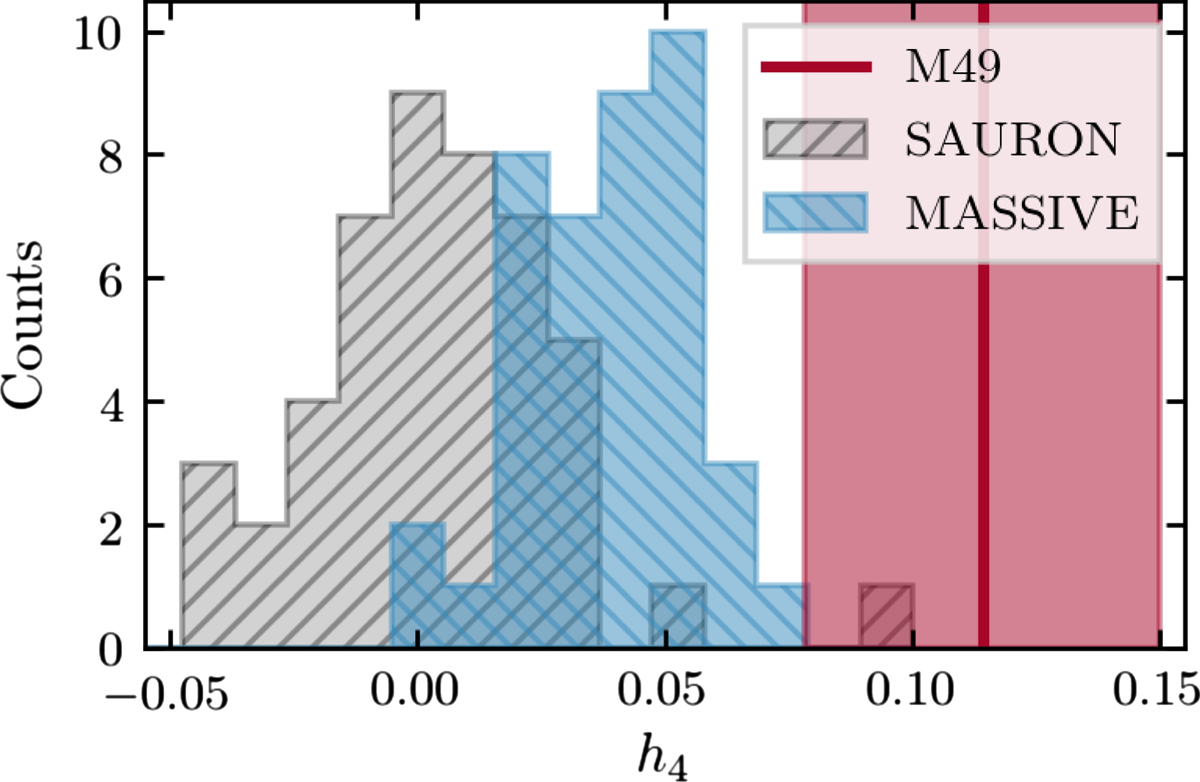
Best-fit h4 value and error band (red vertical line and shaded region) derived from the LOSVD of the faint sample compared to the h4 distribution of 47 and 41 ETGs from the SAURON (Emsellem et al. 2004) and MASSIVE (Veale et al. 2017) surveys (grey and blue histograms).
Current usage metrics show cumulative count of Article Views (full-text article views including HTML views, PDF and ePub downloads, according to the available data) and Abstracts Views on Vision4Press platform.
Data correspond to usage on the plateform after 2015. The current usage metrics is available 48-96 hours after online publication and is updated daily on week days.
Initial download of the metrics may take a while.