Fig. 4.
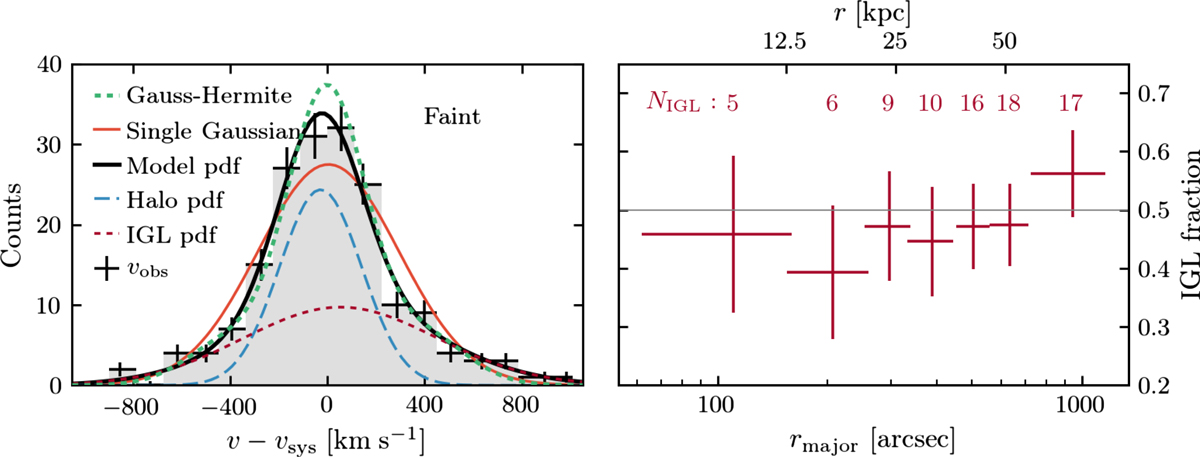
Left: LOSVD of the faint component (grey histogram with errorbars) and best-fit model pdf (black line), consisting of the halo (dashed blue line) and IGL (dotted red line), and scaled to the observed LOSVD. While the likelihood is fit with a bin-free method, we bin the LOSVD for visual convenience. For comparison, the best-fit single-Gaussian model is shown in orange. The dashed green line denotes the best-fit Gauss-Hermite expansion. Right: fraction of faint PNe associated with the IGL as a function of major-axis radius, based on the probabilities derived from the LOSVD decomposition. The number of PNe associated with the IGL is given on top of each bin.
Current usage metrics show cumulative count of Article Views (full-text article views including HTML views, PDF and ePub downloads, according to the available data) and Abstracts Views on Vision4Press platform.
Data correspond to usage on the plateform after 2015. The current usage metrics is available 48-96 hours after online publication and is updated daily on week days.
Initial download of the metrics may take a while.