Fig. 4.
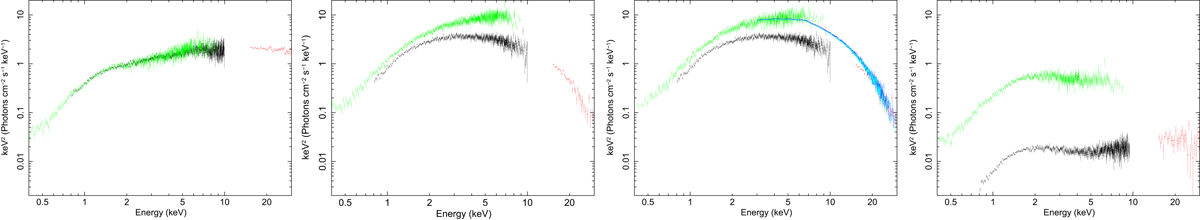
Background-subtracted Swift/XRT spectra of Aql X-1 for obs 1 (left panel), 2a (middle-left panel), 2b (middle-right panel) and 3 (right panel) after deconvolution with the response matrix using, as a model, a power law of index 2. In each panel, we show the Swift/XRT spectra (in green) together with Suzaku broad-band spectra (in black and red) taken at similar epochs during outburst evolution. For obs 2b, we also show the NuSTAR simultaneous spectra (pink, light blue for FPMA/B, respectively). Based only on the comparison to broad-band spectra from previous outbursts, we identify obs 1 and 3 with hard states and obs 2a and 2b with soft states (see text).
Current usage metrics show cumulative count of Article Views (full-text article views including HTML views, PDF and ePub downloads, according to the available data) and Abstracts Views on Vision4Press platform.
Data correspond to usage on the plateform after 2015. The current usage metrics is available 48-96 hours after online publication and is updated daily on week days.
Initial download of the metrics may take a while.