Fig. 3.
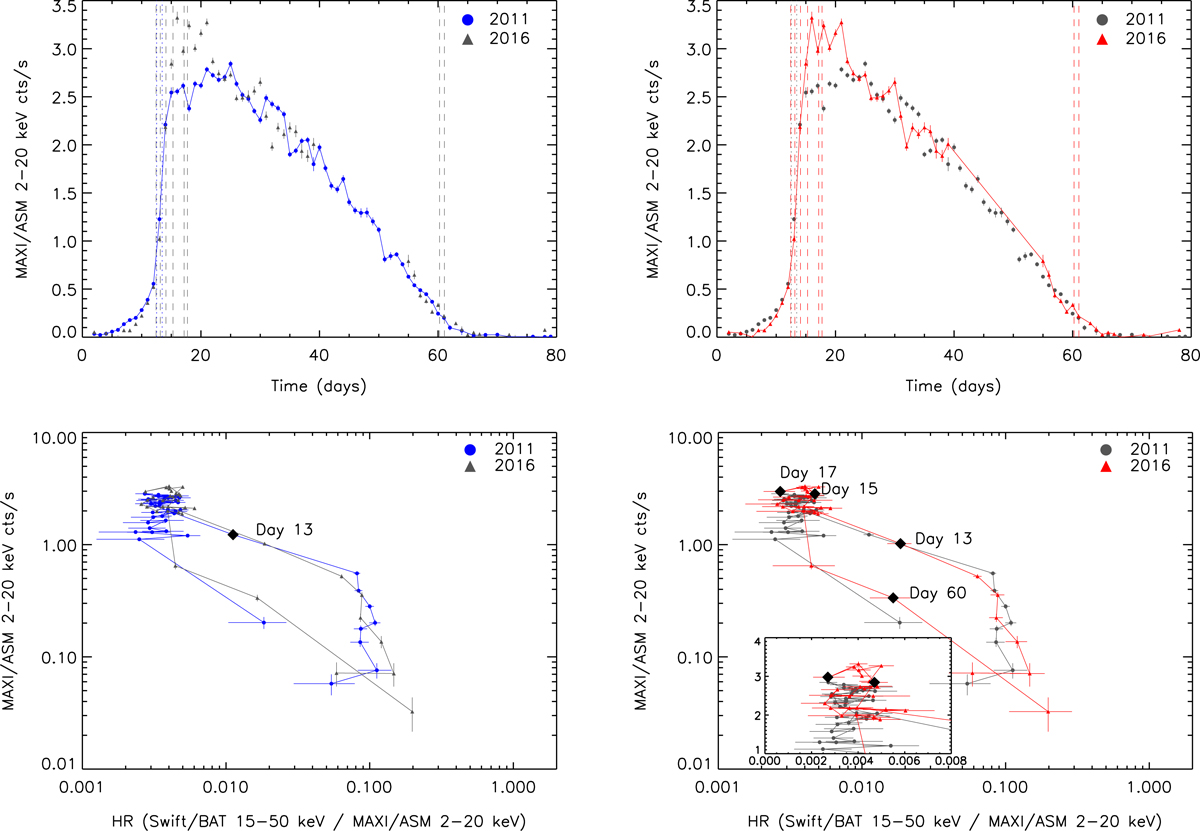
MAXI 2–20 keV light curves (upper plots) and hardness-intensity diagrams (lower plots) for the 2011 and 2016 outbursts of Aql X-1. The light curves show days since the start of outburst (MJD 55843 and 57590 for the 2011 and 2016 outbursts, respectively). The vertical lines mark the time elapsed by the pointed observations: blue lines correspond to the Suzaku observations in 2011 and red to the observations in 2016 presented here. The black diamonds mark the day during which the pointed Suzaku observations during the 2011 outburst (lower-left) and the Swift/XRT observations listed in Table 1 (lower-right) were performed. The inset in the lower-right panel shows a zoom of the region of the HID where obs 2a and 2b are placed. In the lower panels, only diamonds that have a hardness ratio with >2σ significance are shown.
Current usage metrics show cumulative count of Article Views (full-text article views including HTML views, PDF and ePub downloads, according to the available data) and Abstracts Views on Vision4Press platform.
Data correspond to usage on the plateform after 2015. The current usage metrics is available 48-96 hours after online publication and is updated daily on week days.
Initial download of the metrics may take a while.