Fig. 1.
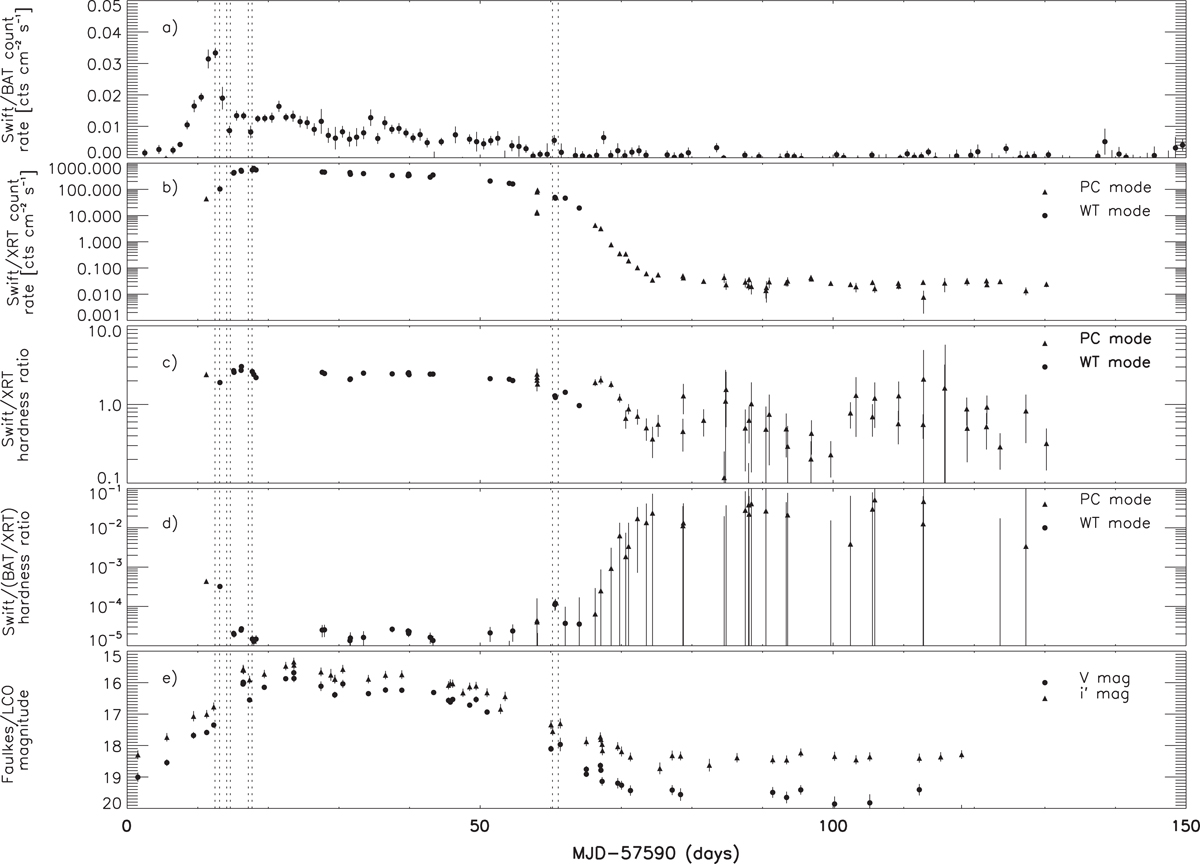
X-ray and optical light curves of Aql X-1. The start and end times of the four multi-wavelength observations listed in Table 1 are indicated with dotted lines. The start of each multi-wavelength observation is defined as the start time of the first observation within a set; for example, the start of the ATCA/VLT observations mark the start of obs 1/2a, respectively. Similarly, the end of each multi-wavelength observation is defined as the end time of the last observation within a set; for example, the end of the Swift/ALMA observations mark the end of obs 1/2a, respectively. Panel a: Swift/BAT 15–50 keV count rate. Panel b: Swift/XRT 0.3–10 keV count rate (count rates in PC mode could be affected by pile-up at count rates above ~1 cts s−1). Panel c: Swift/XRT hardness ratio (1.5–10 keV/0.3–1.5 keV count rate). Panel d: Swift/(BAT/XRT) hardness ratio (15–50 keV/0.3–10 keV count rate). The hardness ratio is calculated for days on which there is a Swift/XRT point and a Swift/BAT point within one day. Panel e: Faulkes/LCO V and i′ magnitudes.
Current usage metrics show cumulative count of Article Views (full-text article views including HTML views, PDF and ePub downloads, according to the available data) and Abstracts Views on Vision4Press platform.
Data correspond to usage on the plateform after 2015. The current usage metrics is available 48-96 hours after online publication and is updated daily on week days.
Initial download of the metrics may take a while.