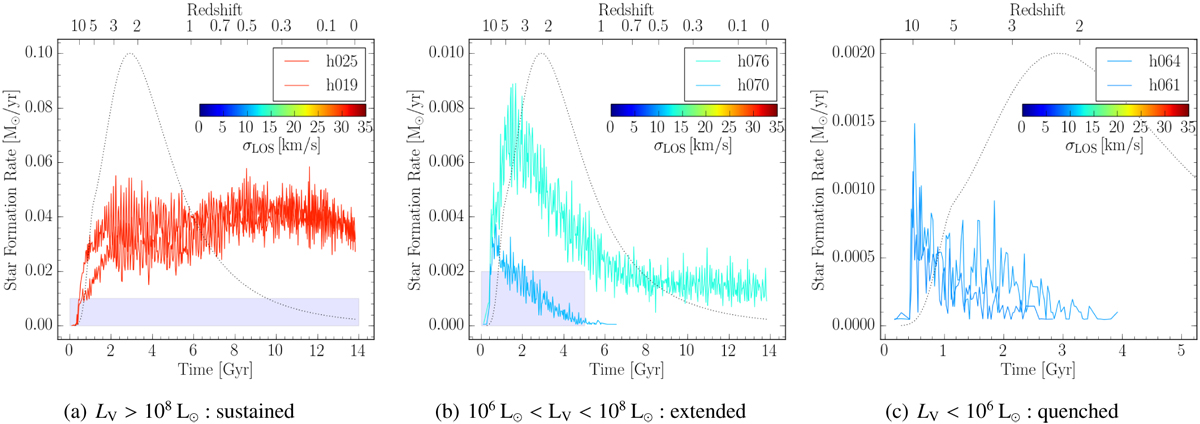
Fig. 9

The three categories of star formation histories observed: sustained, extended and quenched. The colours code the model galaxy velocity dispersion. The dotted black curves show the redshift dependent hydrogen photo-heating rate due to the UV-background photons. The curves are normalized so that the peak of the photo-heating rate coincides with the top of the y-axis. To illustrate the change in intensity and length of the star formation histories between the three categories, the shaded rectangles in panels a and b have dimensions corresponding to the maximal x- and y-axis extensions of the panels b and c, respectively.
Current usage metrics show cumulative count of Article Views (full-text article views including HTML views, PDF and ePub downloads, according to the available data) and Abstracts Views on Vision4Press platform.
Data correspond to usage on the plateform after 2015. The current usage metrics is available 48-96 hours after online publication and is updated daily on week days.
Initial download of the metrics may take a while.


