Fig. 3
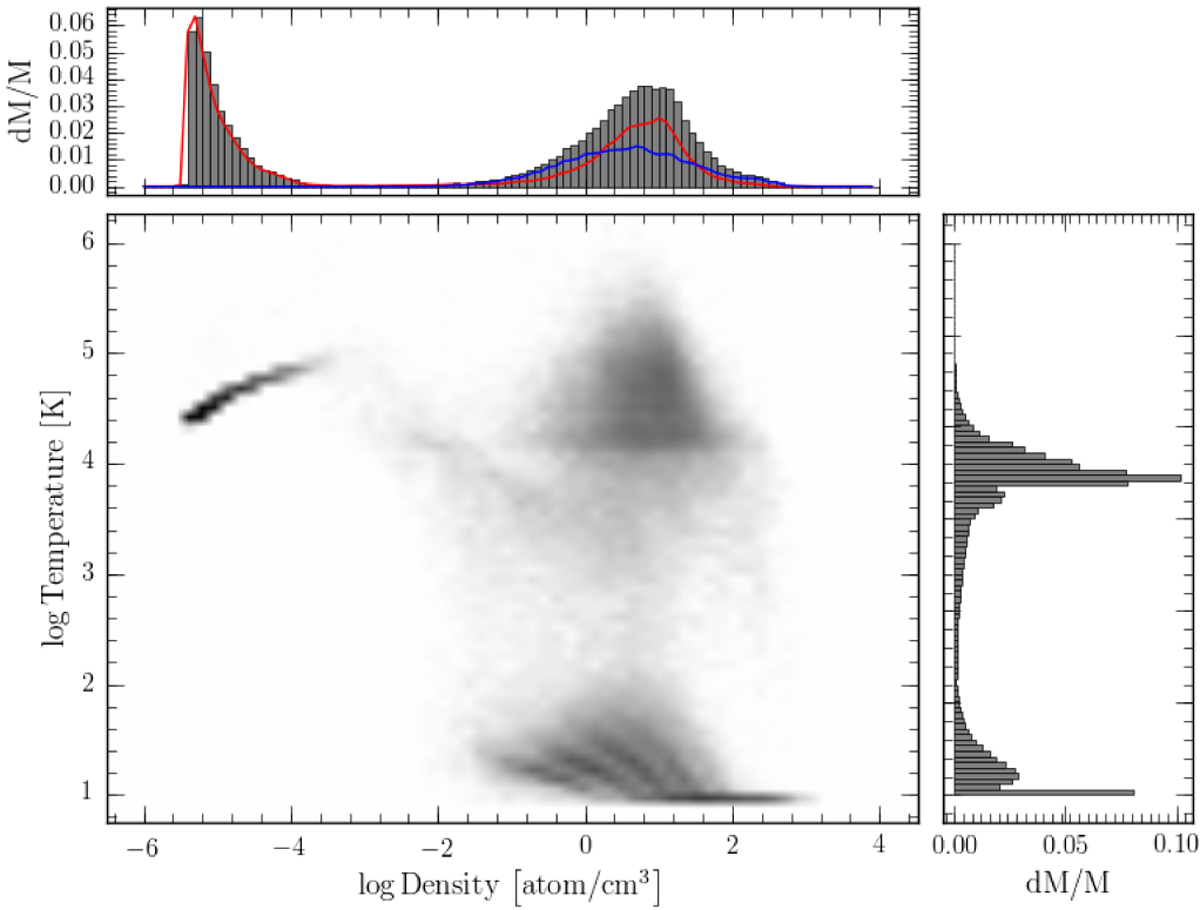
Distribution of the gas in logρ versus logT for the model h025 at a redshift z = 0. The intensity of the grey colour scales with the logarithmic of the 2-D mass-weighted histogram of the gas. The upper and right panels display the gas fraction as a function of its density and temperature, respectively. The red and the blue curves in the upper panel correspond to the warm/hot and cold gas distribution.
Current usage metrics show cumulative count of Article Views (full-text article views including HTML views, PDF and ePub downloads, according to the available data) and Abstracts Views on Vision4Press platform.
Data correspond to usage on the plateform after 2015. The current usage metrics is available 48-96 hours after online publication and is updated daily on week days.
Initial download of the metrics may take a while.