Fig. 11
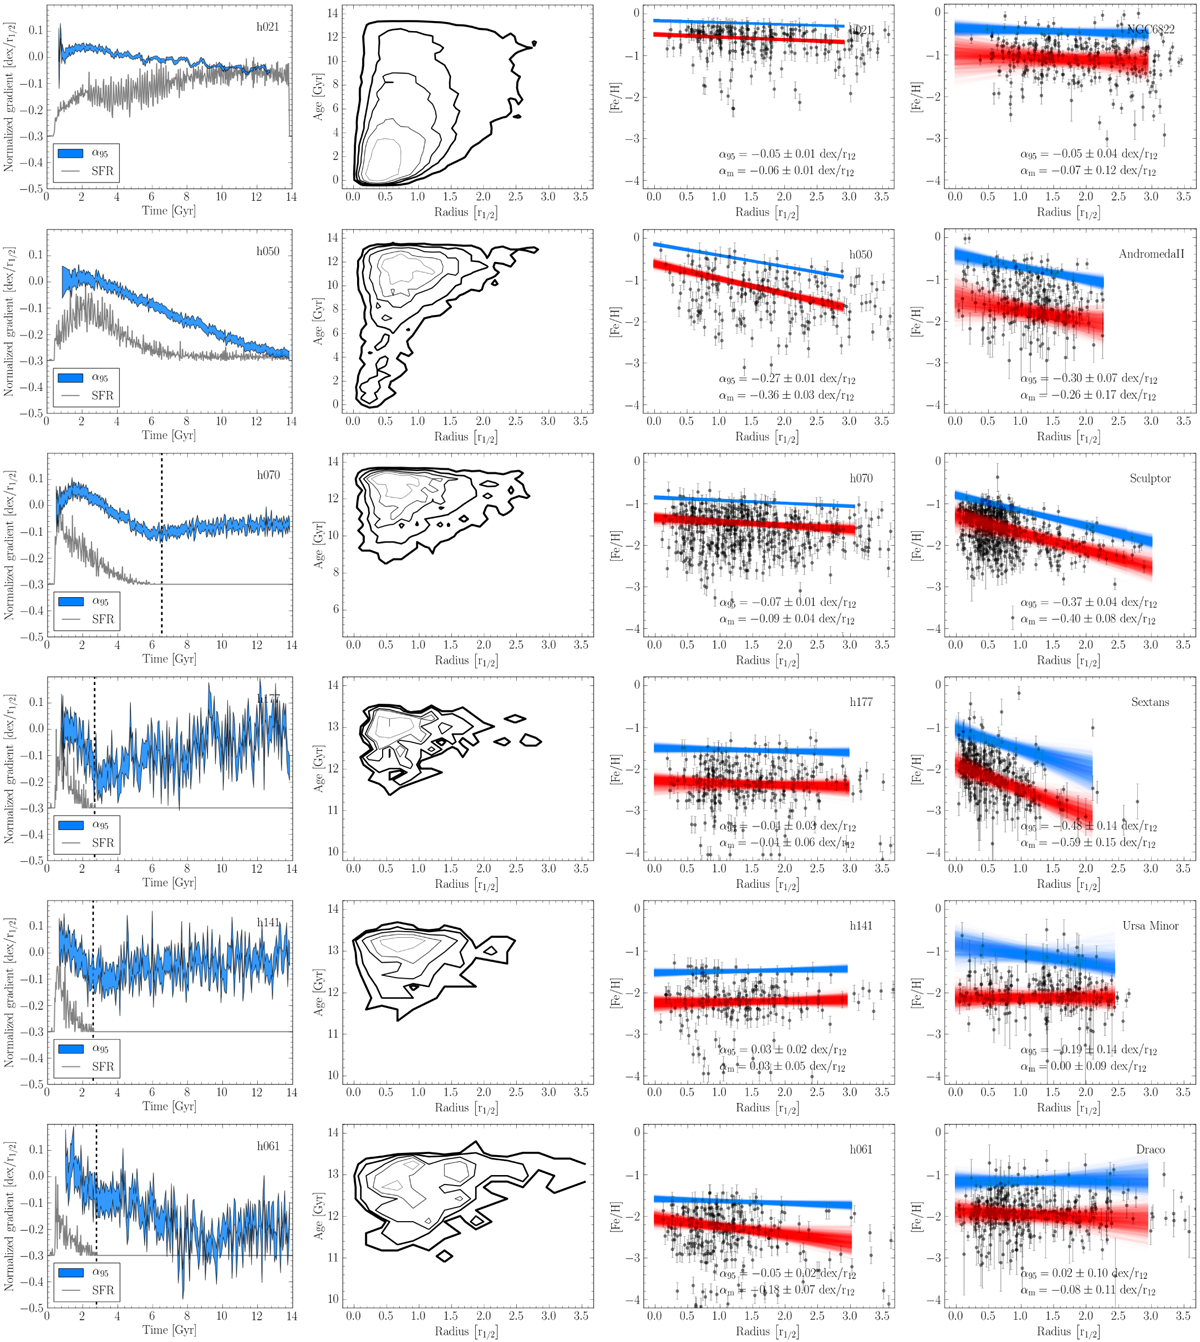
Metallicity and age gradients of the simulated dwarf galaxies as compared to the observations. The first column shows the time evolution of the normalized [Fe/H]gradients determined by the 95th percentile (α95, in blue) of the model galaxy stellar metallicity distribution. The width of the curve traces the error on the slopes (see text for details). The grey curve corresponds to the normalizedstar formation rate and, when displayed, the vertical dashed line indicates the end of the star formation period. The second column shows the age distribution of the stars in as function of the galaxy projected radius. The third and fourth columns compare the metallicity gradients of each model at z = 0, to a corresponding observed galaxy. The red and blue lines correspond to the fit of the mode (red) and 95th percentile (blue) of the observed and model stellar metallicity distributions. Their width reflect the uncertainty on the slope. The values of αm and α95 together with their error bars are provided. For a fair comparison, the number of stars in the model and in the observed are equal.
Current usage metrics show cumulative count of Article Views (full-text article views including HTML views, PDF and ePub downloads, according to the available data) and Abstracts Views on Vision4Press platform.
Data correspond to usage on the plateform after 2015. The current usage metrics is available 48-96 hours after online publication and is updated daily on week days.
Initial download of the metrics may take a while.