Open Access
Fig. 2
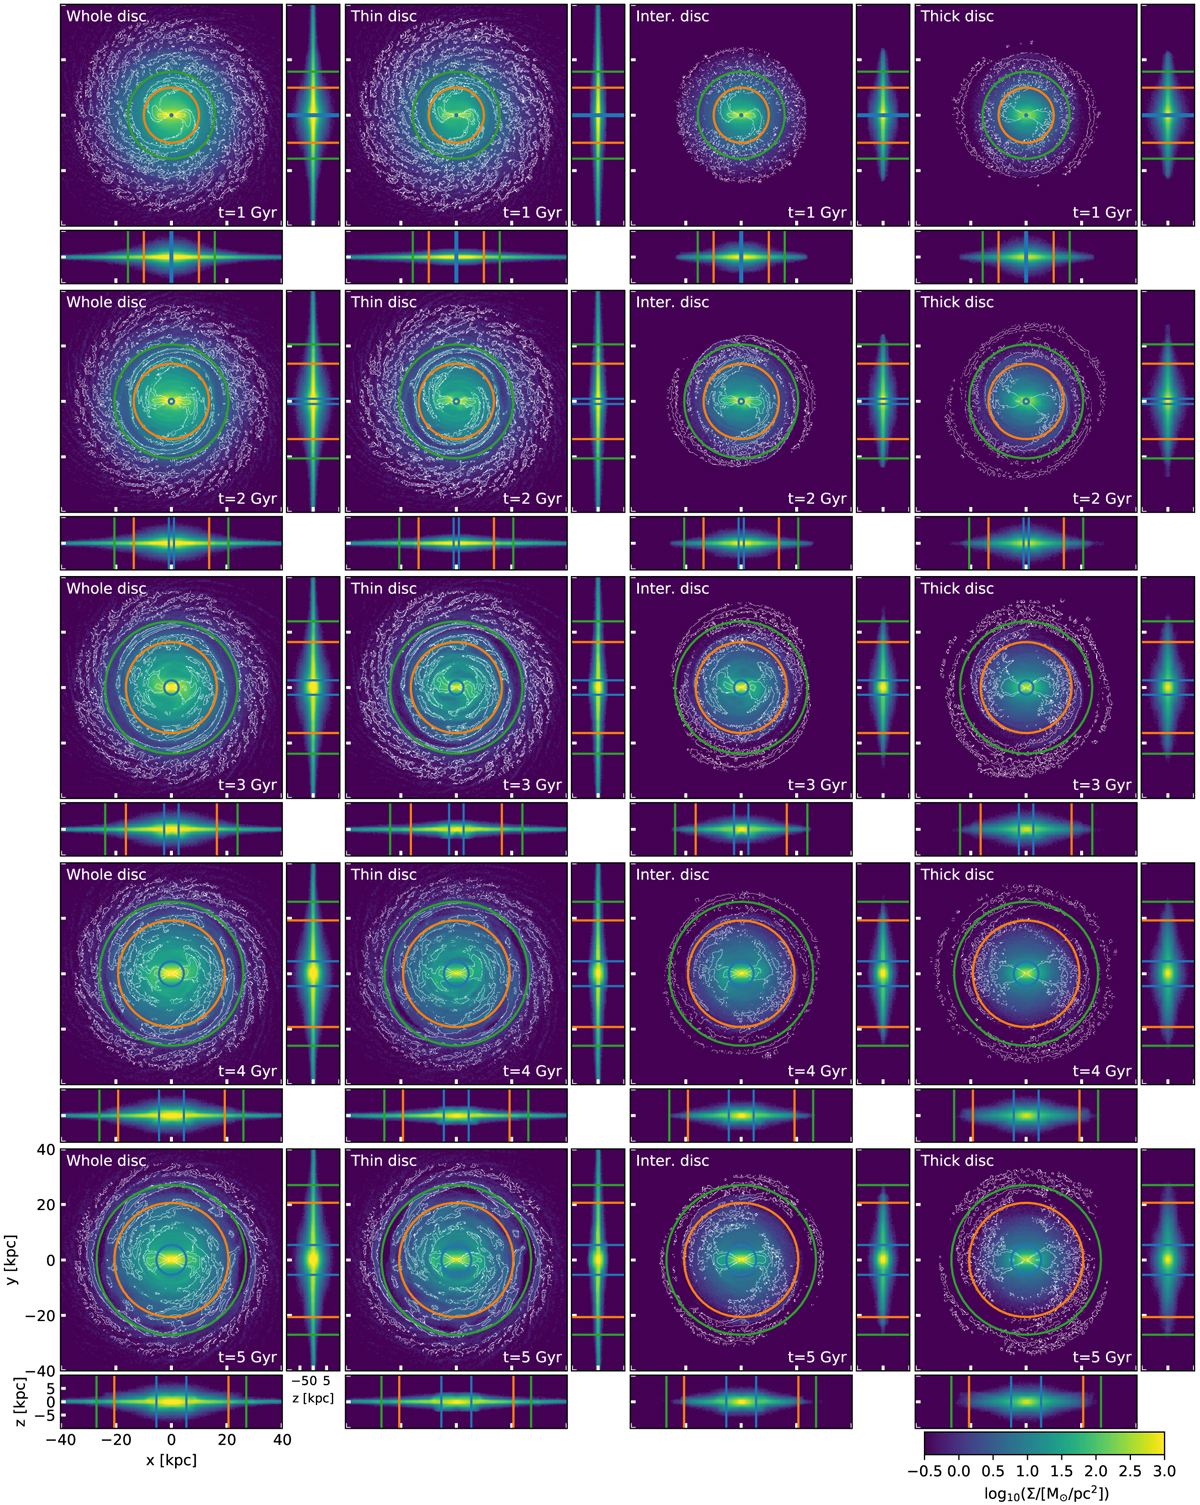
Face-on and edge-on surface density maps of disc components and the whole disc at different times. White contours show azimuthal overdensity (see text for details). Circles (and lines on edge-on views) show ILR (blue), corotation (orange) and OLR (green) radii.
Current usage metrics show cumulative count of Article Views (full-text article views including HTML views, PDF and ePub downloads, according to the available data) and Abstracts Views on Vision4Press platform.
Data correspond to usage on the plateform after 2015. The current usage metrics is available 48-96 hours after online publication and is updated daily on week days.
Initial download of the metrics may take a while.