Fig. 8
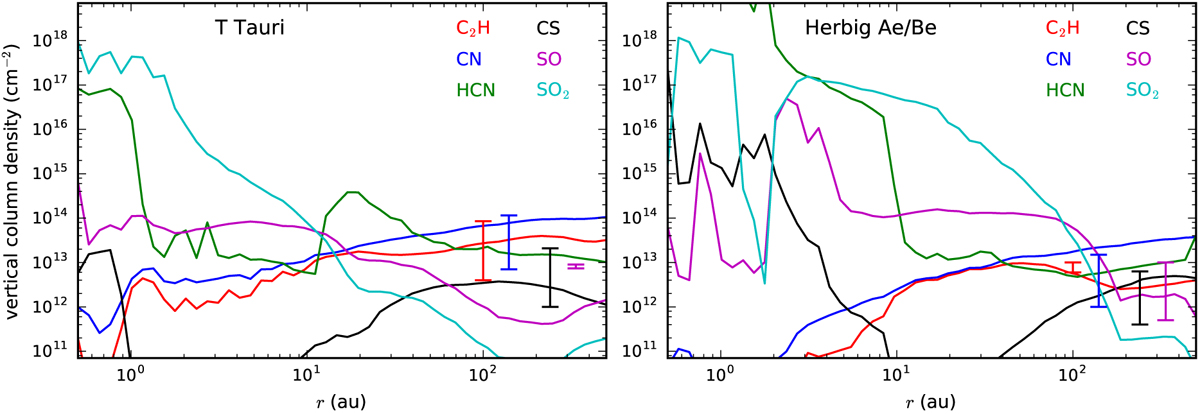
Calculated vertical column densities (down to the midplane) of the radicals C2 H and CN and some sulfur-bearing molecules as a function of radius r for the T Tauri (left panel) and Herbig Ae/Be (right panel) disks. HCN is also shown to allow for the visualization of the CN/HCN ratio. The ranges of column densities derived from observations are indicated by the vertical lines plotted in the outer disk (see Table 3).
Current usage metrics show cumulative count of Article Views (full-text article views including HTML views, PDF and ePub downloads, according to the available data) and Abstracts Views on Vision4Press platform.
Data correspond to usage on the plateform after 2015. The current usage metrics is available 48-96 hours after online publication and is updated daily on week days.
Initial download of the metrics may take a while.