Fig. 36
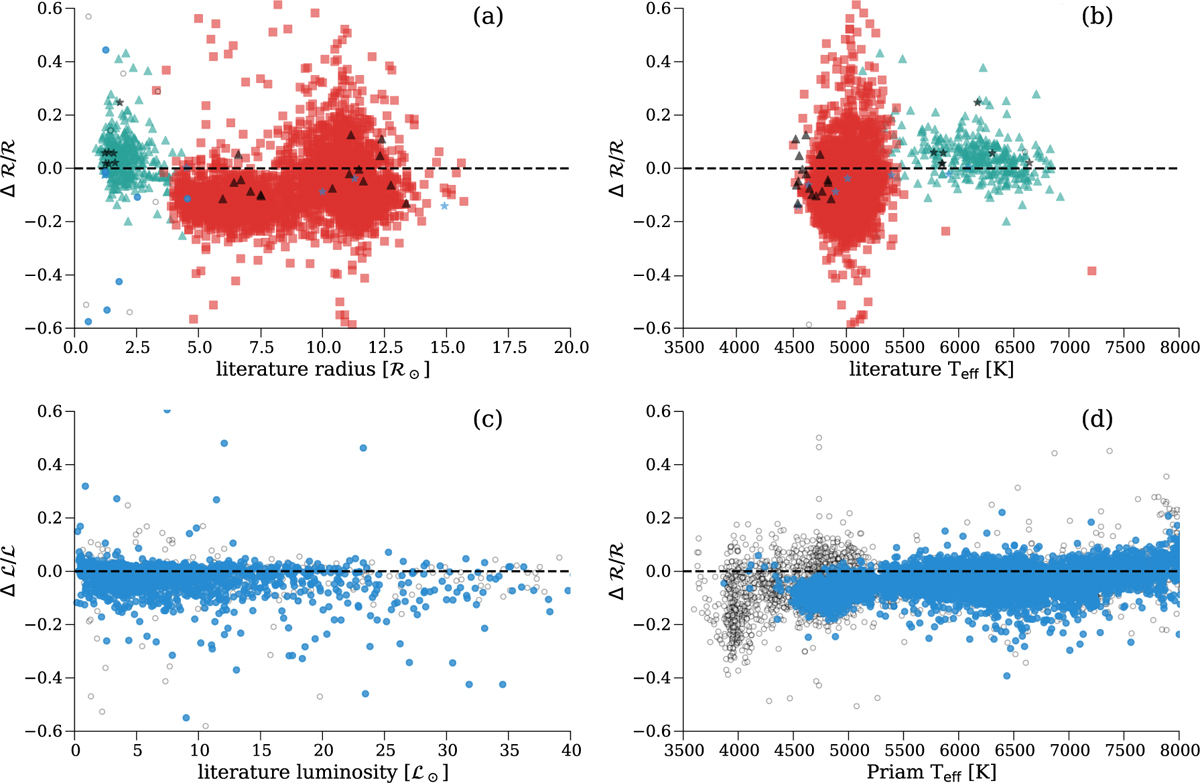
Comparison of R and L with external data. Δ is defined as (FLAME−literature)/literature. Top: comparison of radii as a function of (a) radius and (b) Teff, for asteroseismic and interferometric targets. The symbols indicate different literature sources: red squares are Vrard et al. (2016); green triangles are Chaplin et al. (2014); blue stars are Boyajian et al. (2013) and Ligi et al. (2016); black stars are Creevey et al. (2017); black triangles are members of NGC 6819 from Basu et al. (2011). Bottom: comparison of (c) FLAME luminosities with those from Casagrande et al. (2011) and (d) FLAME radii with those from Bourges et al. (2017). The blue circles are the subsample of stars used to estimate BCG ⊙ (see Appendix D). The open black circles are other stars not fulfilling the stricter criteria for this estimate.
Current usage metrics show cumulative count of Article Views (full-text article views including HTML views, PDF and ePub downloads, according to the available data) and Abstracts Views on Vision4Press platform.
Data correspond to usage on the plateform after 2015. The current usage metrics is available 48-96 hours after online publication and is updated daily on week days.
Initial download of the metrics may take a while.