Fig. 32
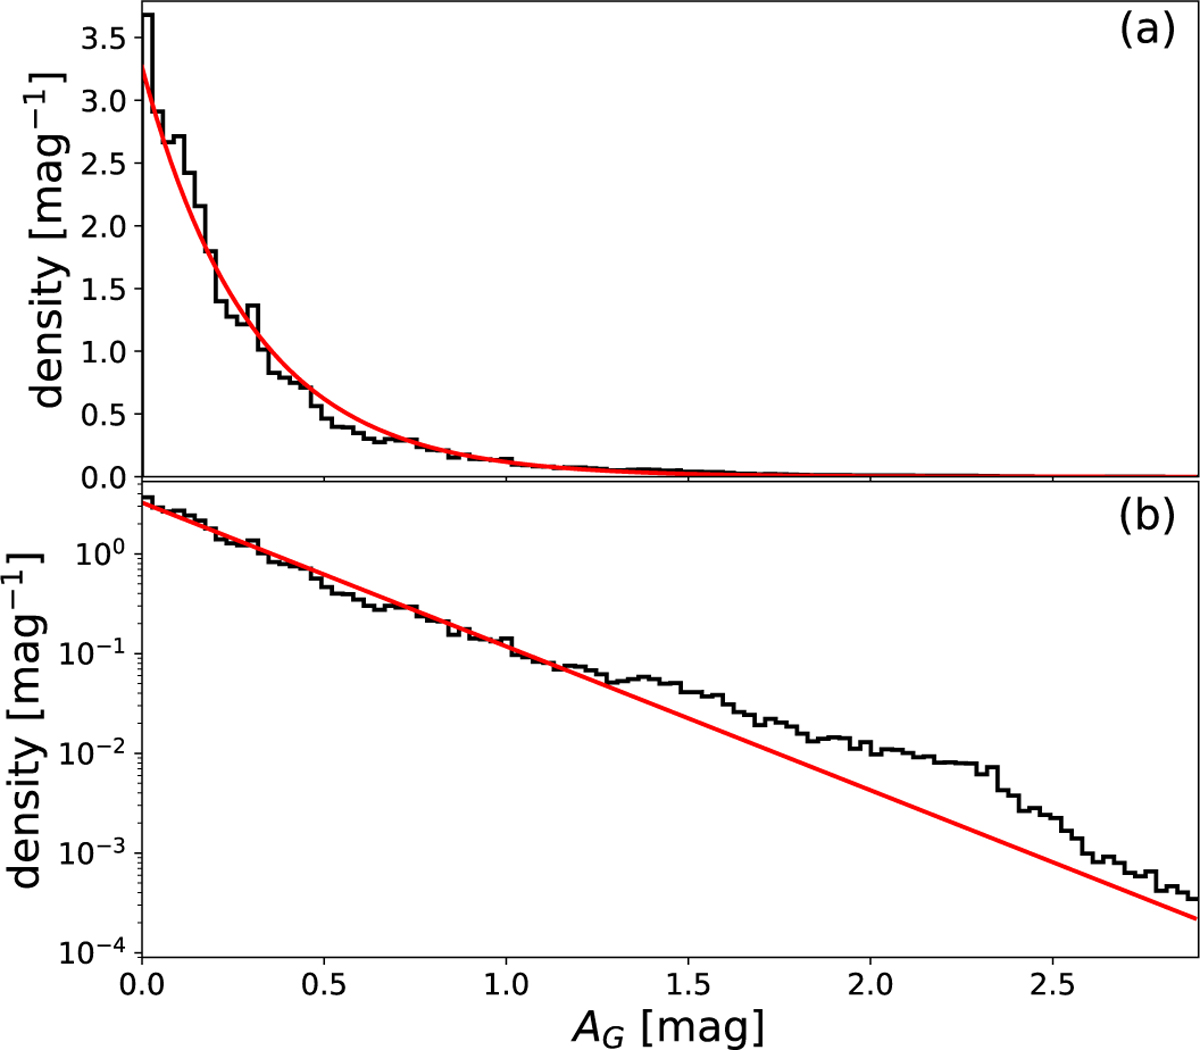
Distribution of AG for high Galactic latitude stars with |b| > 50° after applying the filters from Eqs. (8)–(10) (black histogram). The red line shows an exponential whose mean value is set to the mean extinction of this sample, which is 0.30 mag. Panels a and b show both distributions in linear and logarithmic scale, respectively.
Current usage metrics show cumulative count of Article Views (full-text article views including HTML views, PDF and ePub downloads, according to the available data) and Abstracts Views on Vision4Press platform.
Data correspond to usage on the plateform after 2015. The current usage metrics is available 48-96 hours after online publication and is updated daily on week days.
Initial download of the metrics may take a while.