Fig. 30
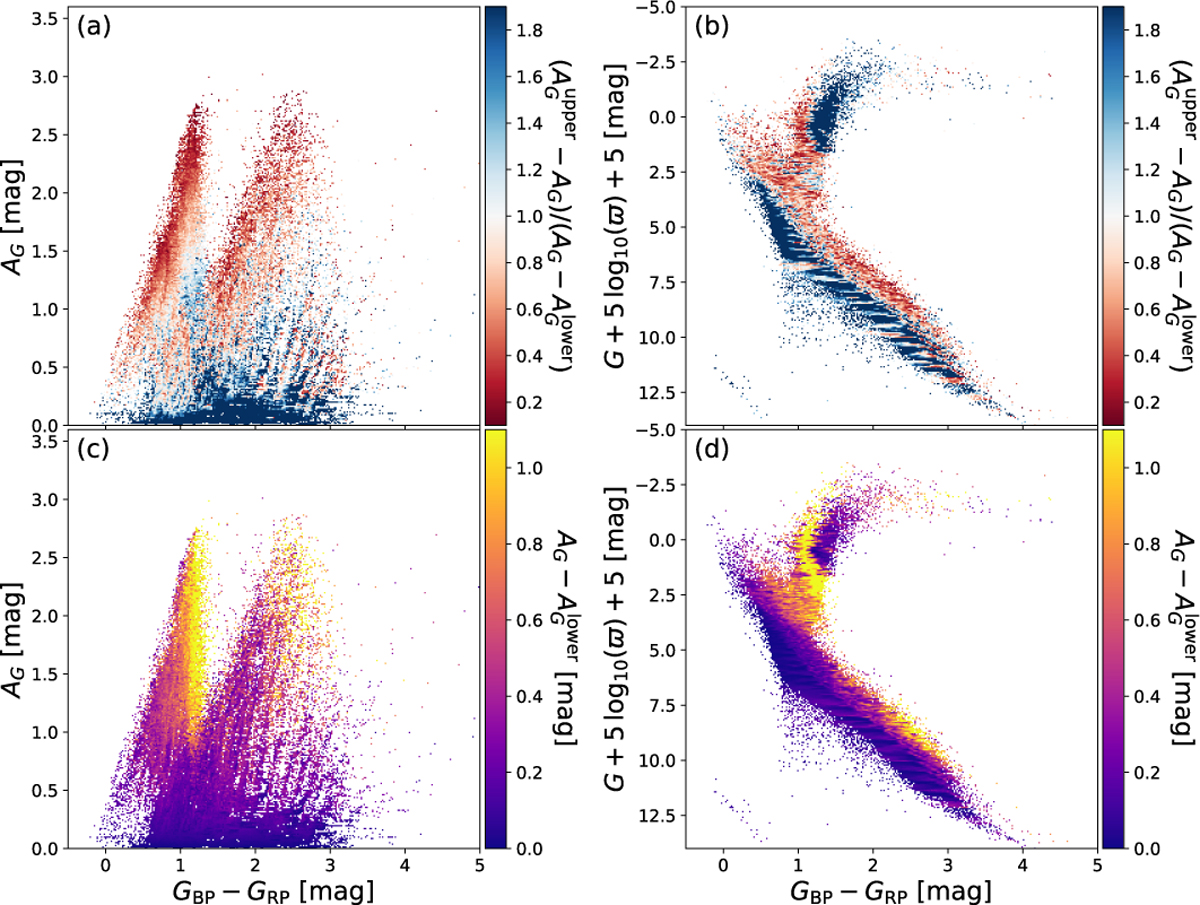
Identification of the most degenerate extinction estimates for high Galactic latitude stars with |b| > 50° before applying the filters of Eqs. (8)–(10). Panels a and b show the identification via the asymmetry of confidence intervals. Panels c and d show the identification via the lower confidence interval. A corresponding plot for E(BP − RP) is provided in the online documentation.
Current usage metrics show cumulative count of Article Views (full-text article views including HTML views, PDF and ePub downloads, according to the available data) and Abstracts Views on Vision4Press platform.
Data correspond to usage on the plateform after 2015. The current usage metrics is available 48-96 hours after online publication and is updated daily on week days.
Initial download of the metrics may take a while.