Fig. 23
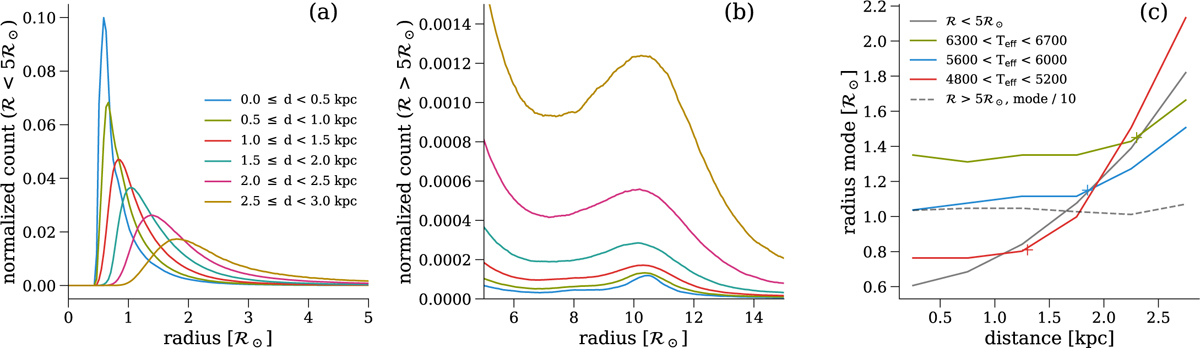
Distribution of radii for different distance bins (different colours) for stars with (a) ![]()
![]() , and (b)
, and (b) ![]() . Panel c: highlights the variation of the mode of the distributions with distance. The crosses indicate to approximately what distance this population of main sequence stars have published radii and luminosities. The solid grey lines and the dashed line show the results corresponding to panels a and b respectively (the latter scaled by a factor of ten). The coloured continuous lines show the results for
. Panel c: highlights the variation of the mode of the distributions with distance. The crosses indicate to approximately what distance this population of main sequence stars have published radii and luminosities. The solid grey lines and the dashed line show the results corresponding to panels a and b respectively (the latter scaled by a factor of ten). The coloured continuous lines show the results for ![]() but for narrower Teff ranges, in order to isolate the impact of the assumptions on extinction from the FLAME filtering criteria.
but for narrower Teff ranges, in order to isolate the impact of the assumptions on extinction from the FLAME filtering criteria.
Current usage metrics show cumulative count of Article Views (full-text article views including HTML views, PDF and ePub downloads, according to the available data) and Abstracts Views on Vision4Press platform.
Data correspond to usage on the plateform after 2015. The current usage metrics is available 48-96 hours after online publication and is updated daily on week days.
Initial download of the metrics may take a while.