Fig. 18
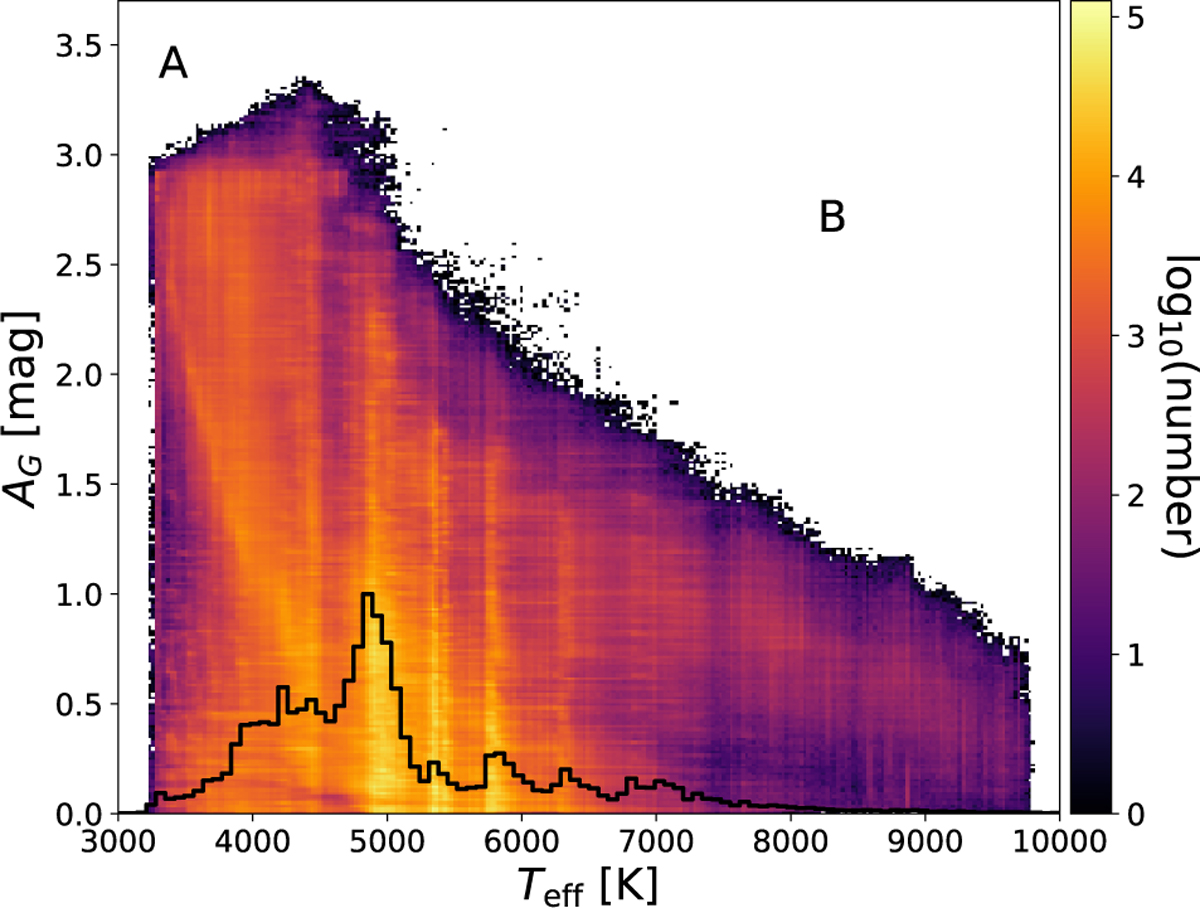
Variation of Priam AG with Priam Teff for all stars with clean flags and parallax uncertainty less than 20%. Two unoccupied regions in this plane are marked by “A” and “B”. The black histogram at the bottom shows the total distribution of Teff in our training sample, i.e., the sum over all catalogues shown in Fig. 5. The histogram peaks coincide with the vertical stripes.
Current usage metrics show cumulative count of Article Views (full-text article views including HTML views, PDF and ePub downloads, according to the available data) and Abstracts Views on Vision4Press platform.
Data correspond to usage on the plateform after 2015. The current usage metrics is available 48-96 hours after online publication and is updated daily on week days.
Initial download of the metrics may take a while.