Fig. 11
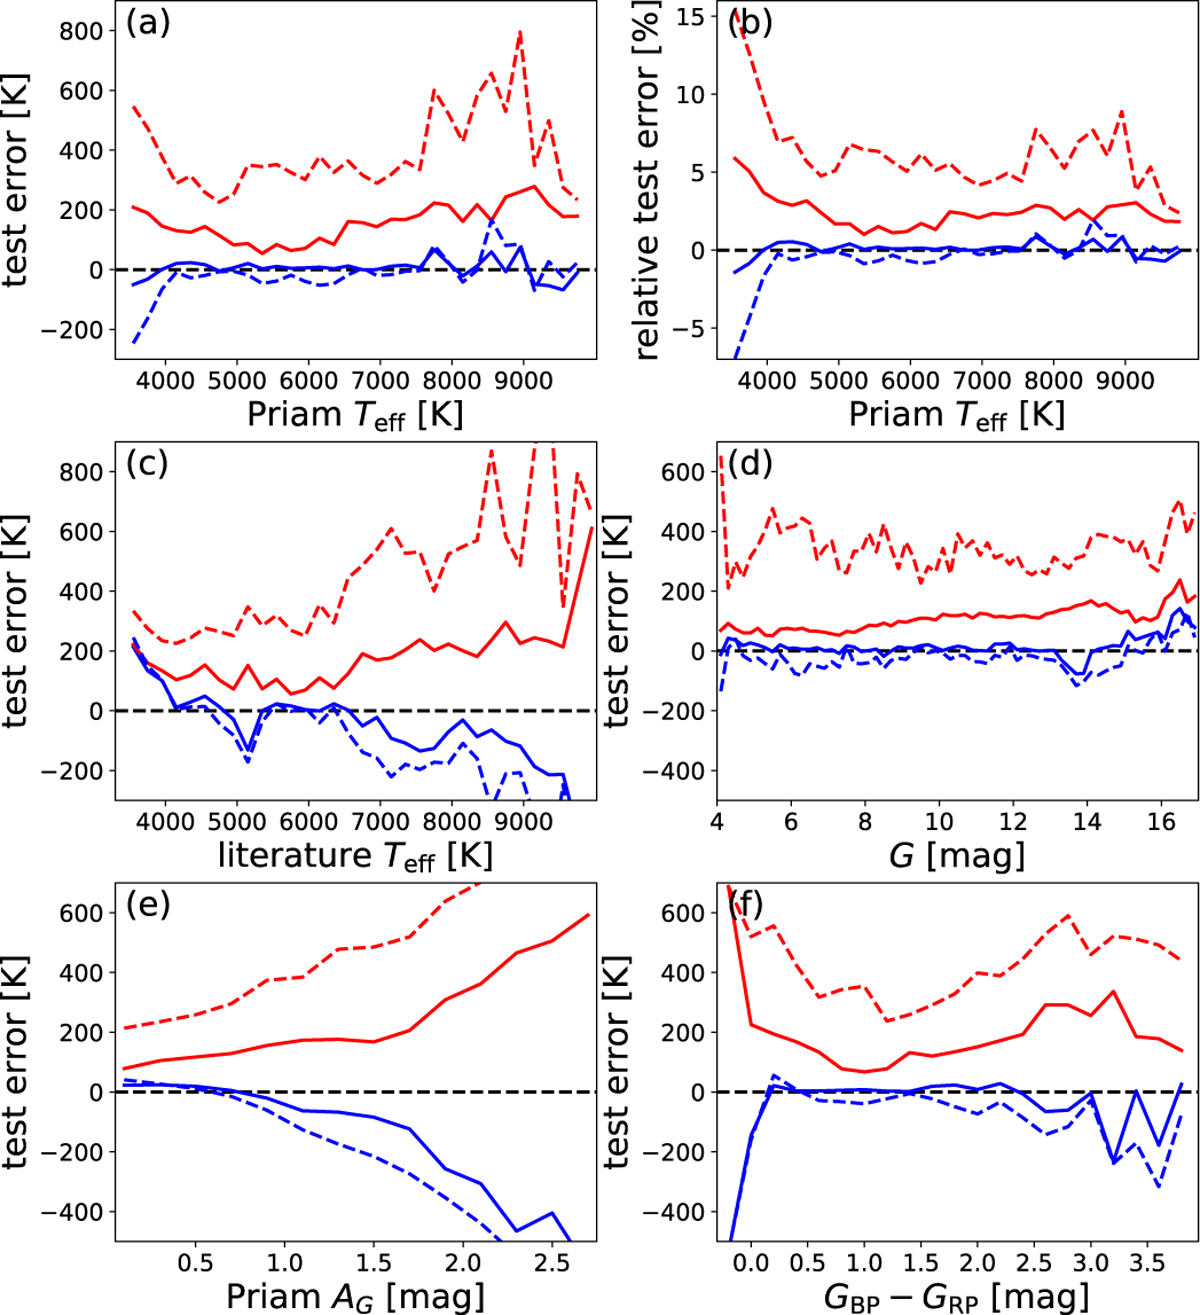
Dependence of Teff test errors on estimated Teff (panel a and relative errors in panel b), on literature Teff (panel c), on G (panel d), estimated AG (panel e) and GBP − GRP colour (panel f). Red lines shows root-mean-squared errors (dashed) and root-median-squared errors (solid). Blue lines show mean errors (dashed) and median errors (solid), as measures of bias.
Current usage metrics show cumulative count of Article Views (full-text article views including HTML views, PDF and ePub downloads, according to the available data) and Abstracts Views on Vision4Press platform.
Data correspond to usage on the plateform after 2015. The current usage metrics is available 48-96 hours after online publication and is updated daily on week days.
Initial download of the metrics may take a while.