Fig. 8
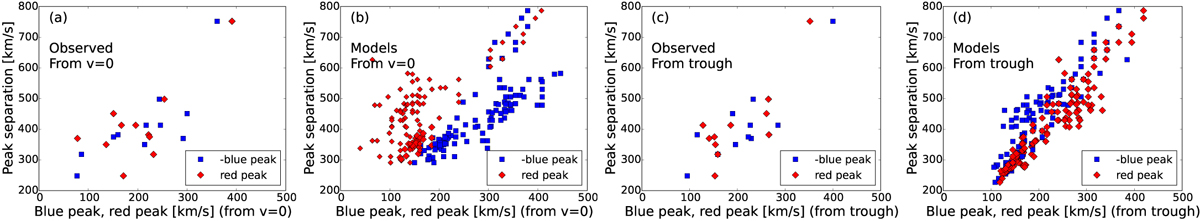
Symmetry of the red and blue Lyα peak positions in the observed and modelled spectra. Panel a: the observed Lyα double-peak separation as a function of the blue and red Lyα peak positions: the distributions are similar for both peaks, the correlation is tighter for the blue peak. Panel b: same as panel a but for shell models; here the correlation is tighter for the blue peak, and the red and blue peaks are not symmetric. Panel c: same as panel a but measured with respect to the central Lyα trough; the correlations here are stronger than in panel a. Panel d: same as panel b but measured with respect to the central Lyα trough; the asymmetry between the red and blue peaks disappears.
Current usage metrics show cumulative count of Article Views (full-text article views including HTML views, PDF and ePub downloads, according to the available data) and Abstracts Views on Vision4Press platform.
Data correspond to usage on the plateform after 2015. The current usage metrics is available 48-96 hours after online publication and is updated daily on week days.
Initial download of the metrics may take a while.