Fig. 7
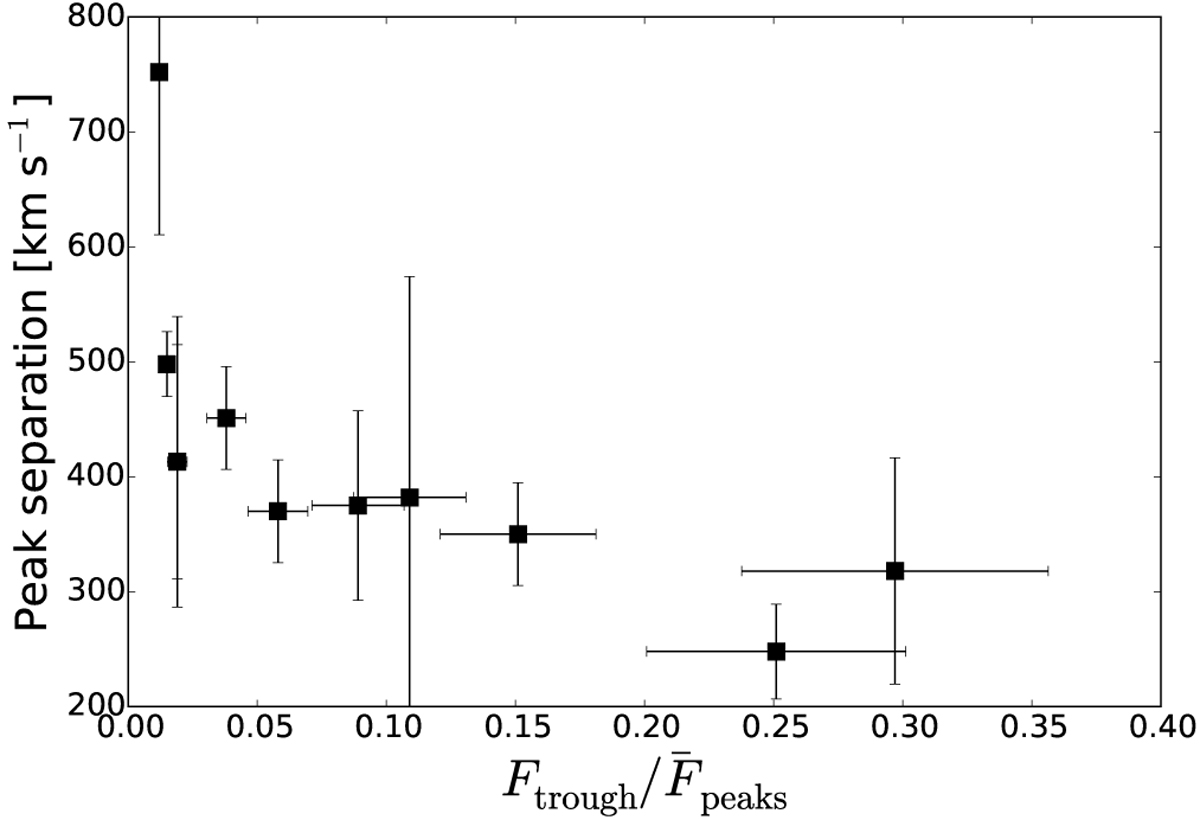
Observed separation between the red and blue Lyα peaks as a functionof the residual flux in the central Lyα trough Ftrough divided by the mean flux in the red and blue Lyα peaks ![]() . An analogous plot was presented for model spectra in Gronke & Dijkstra (2016). No correlation was seen for clumpy models, while a trend was present for homogeneous shell models (see Sect. 5.4).
. An analogous plot was presented for model spectra in Gronke & Dijkstra (2016). No correlation was seen for clumpy models, while a trend was present for homogeneous shell models (see Sect. 5.4).
Current usage metrics show cumulative count of Article Views (full-text article views including HTML views, PDF and ePub downloads, according to the available data) and Abstracts Views on Vision4Press platform.
Data correspond to usage on the plateform after 2015. The current usage metrics is available 48-96 hours after online publication and is updated daily on week days.
Initial download of the metrics may take a while.