Fig. 2
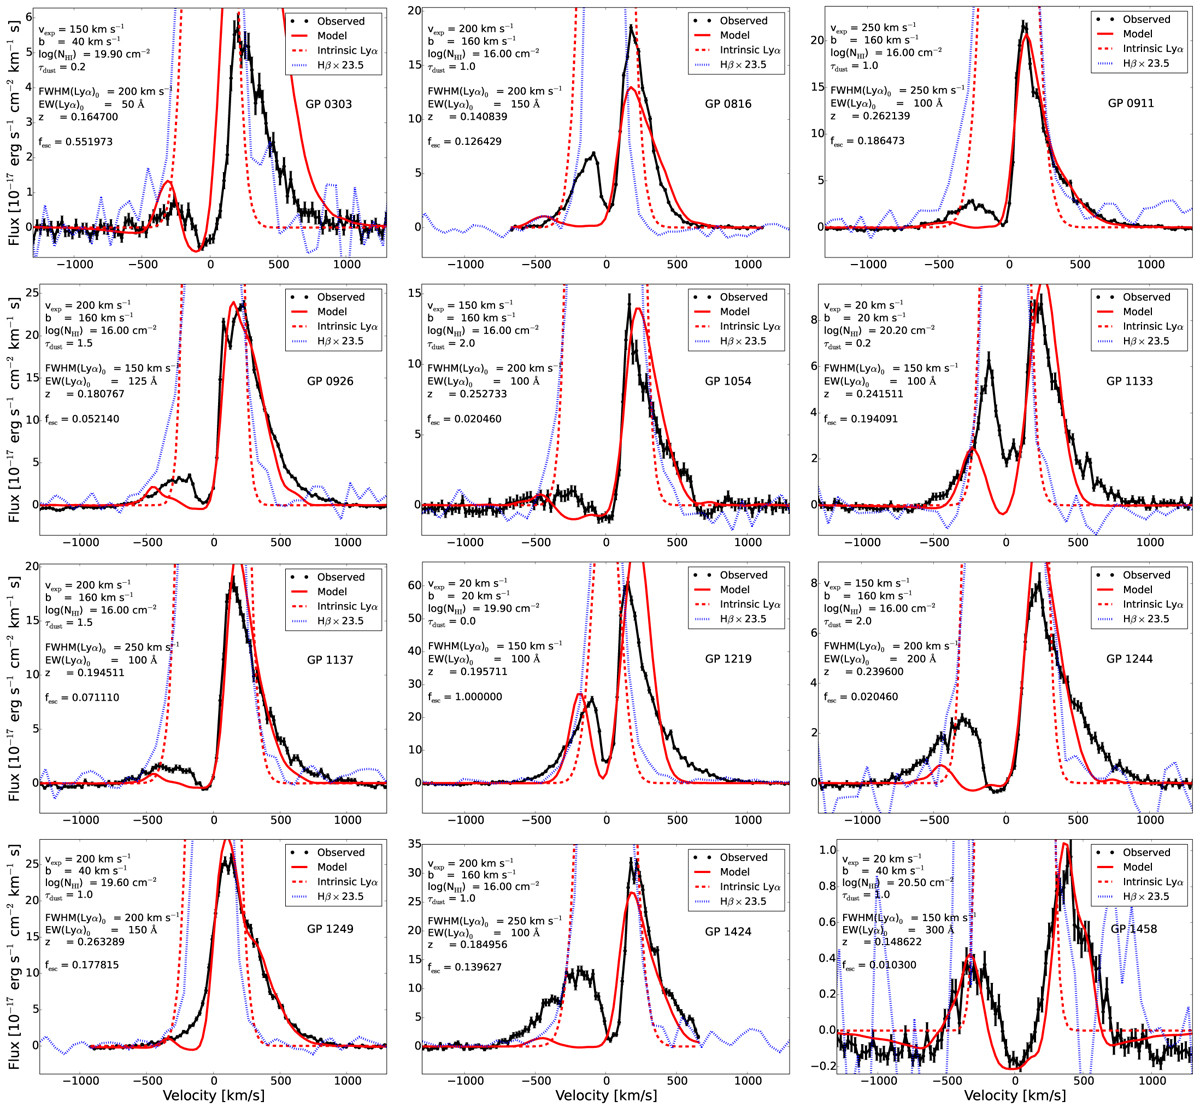
Best-fitting Lyα models with applied constraints from ancillary observational data (Sect. 4.1). COS data and their errorbars are shown in black, the best-fitting model with the solid red line, the modelled intrinsic single-Gaussian Lyα profile with the dashed red line, and the observed SDSS Hβ scaled by Case B factor 23.5 with the dotted blue line. Parameters of the best-fitting model are shown in each panel.
Current usage metrics show cumulative count of Article Views (full-text article views including HTML views, PDF and ePub downloads, according to the available data) and Abstracts Views on Vision4Press platform.
Data correspond to usage on the plateform after 2015. The current usage metrics is available 48-96 hours after online publication and is updated daily on week days.
Initial download of the metrics may take a while.