Fig. 10
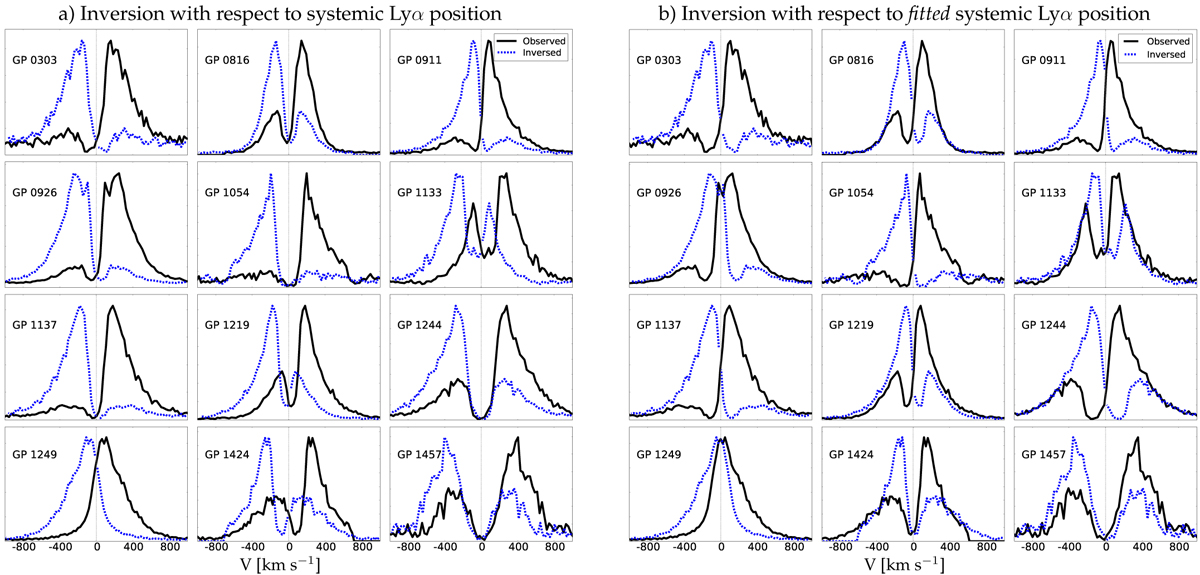
Observed Lyα profile symmetries: with respect to the systemic velocity derived from SDSS redshift (panel a), and with respect to the systemic velocity derived from best-fitting model (panel b). The solid black line shows the observed data, the blue line their inversion. The red and blue wings are more symmetric in case (b) than in case (a).
Current usage metrics show cumulative count of Article Views (full-text article views including HTML views, PDF and ePub downloads, according to the available data) and Abstracts Views on Vision4Press platform.
Data correspond to usage on the plateform after 2015. The current usage metrics is available 48-96 hours after online publication and is updated daily on week days.
Initial download of the metrics may take a while.