Fig. 1
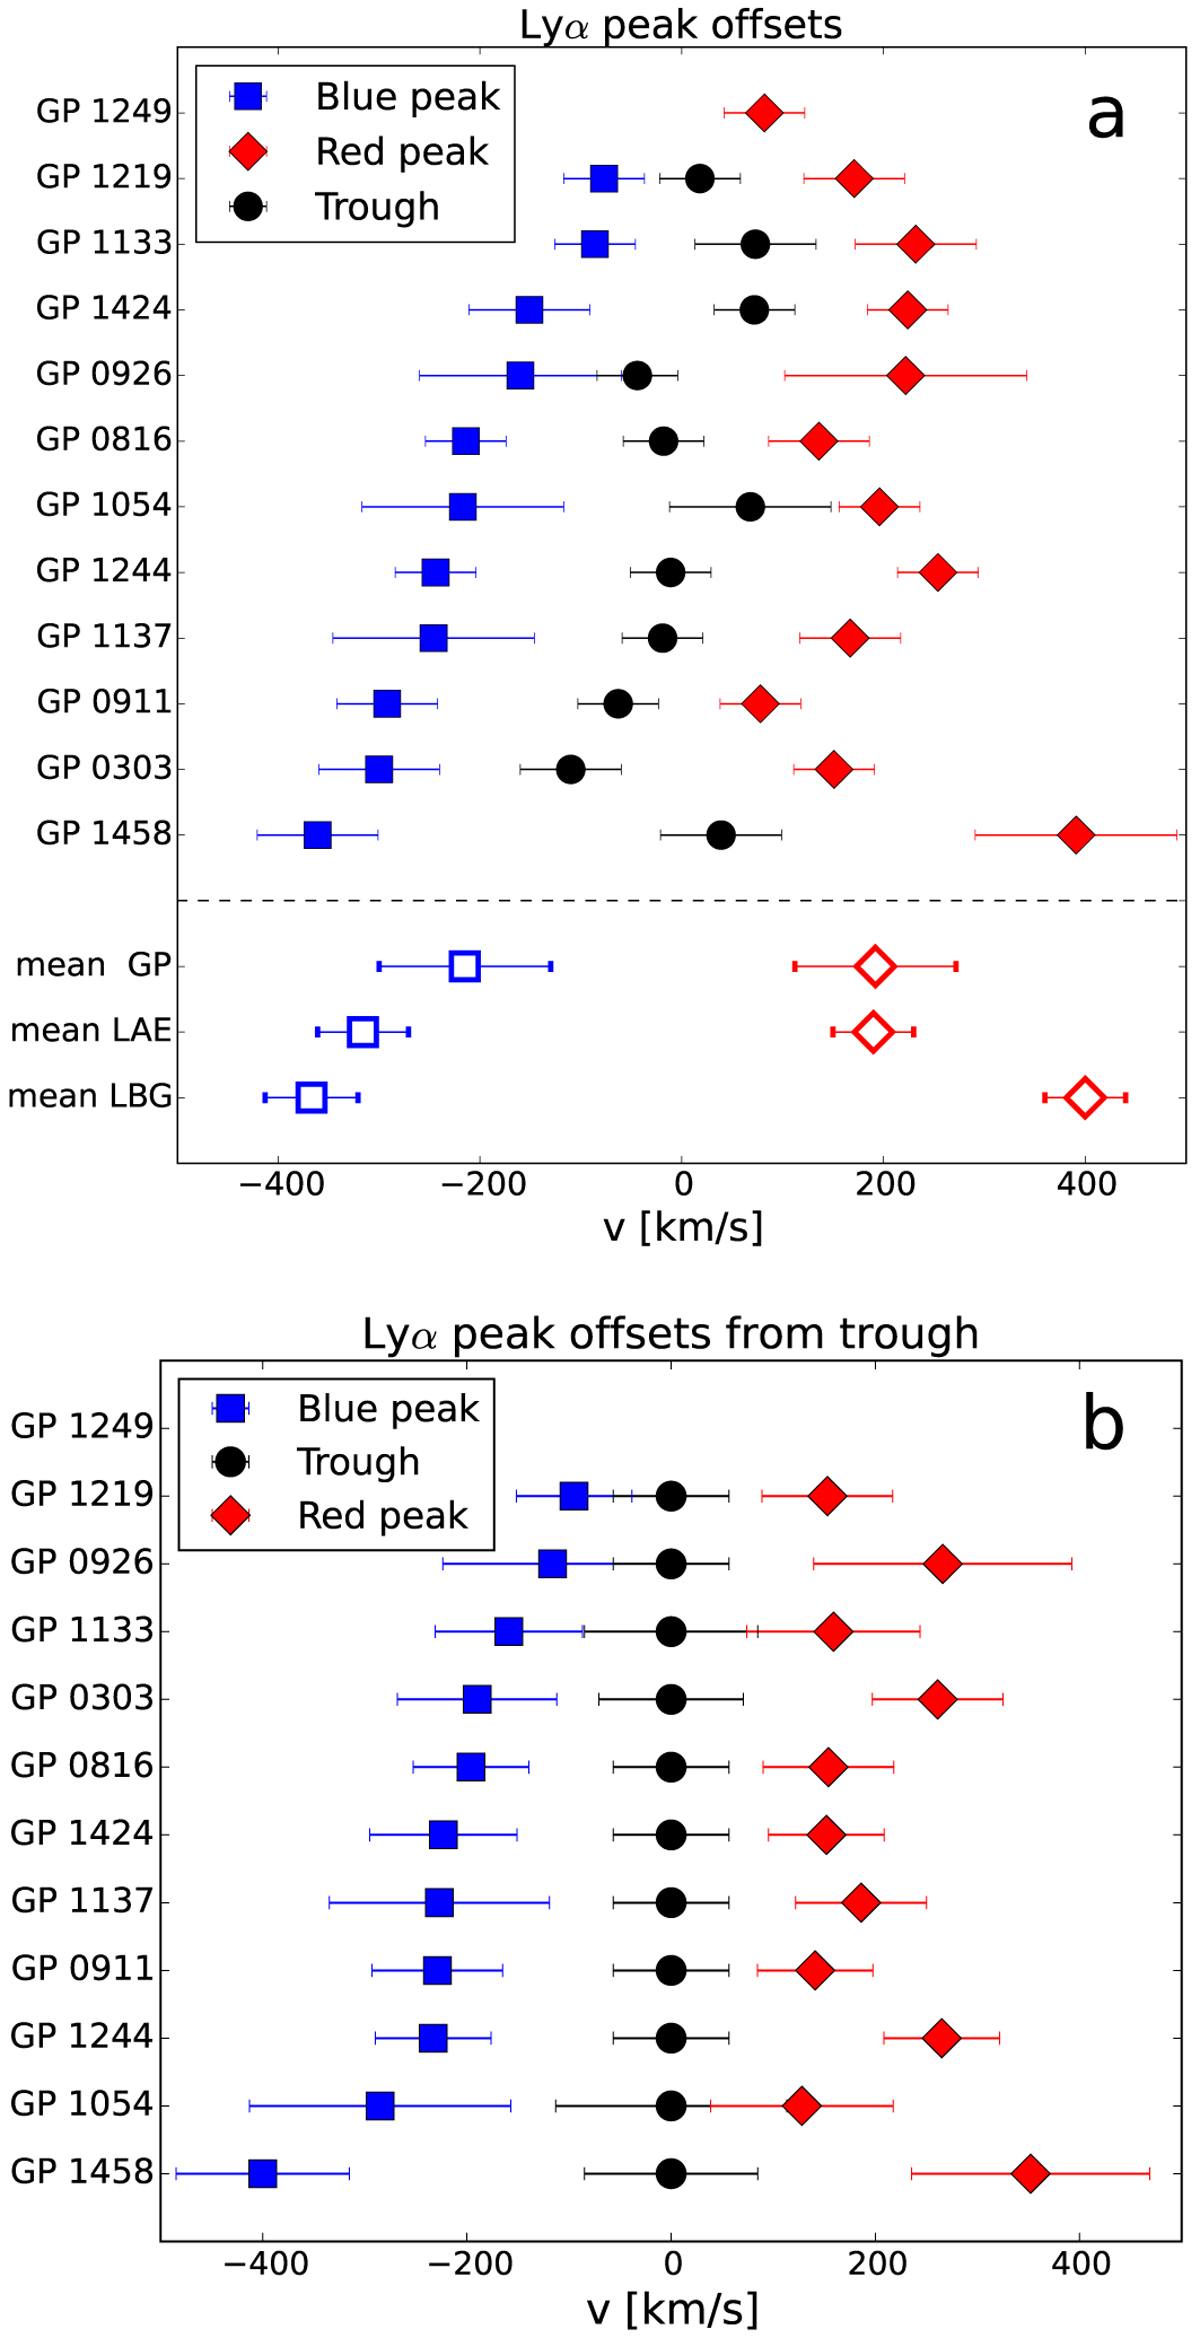
Asymmetry of the blue and red Lyα peaks in the GP sample, measured from (panel a) the systemic redshift, and (panel b) the central trough. Panel a also includes the mean positions of the blue and red peaks for this GP sample, and for LAE and LBG samples drawn from the literature (Hashimoto et al. 2015). The GPs are similar to the LAEs in the red peak positions, but have a smaller mean blue offset.
Current usage metrics show cumulative count of Article Views (full-text article views including HTML views, PDF and ePub downloads, according to the available data) and Abstracts Views on Vision4Press platform.
Data correspond to usage on the plateform after 2015. The current usage metrics is available 48-96 hours after online publication and is updated daily on week days.
Initial download of the metrics may take a while.