Fig. 6
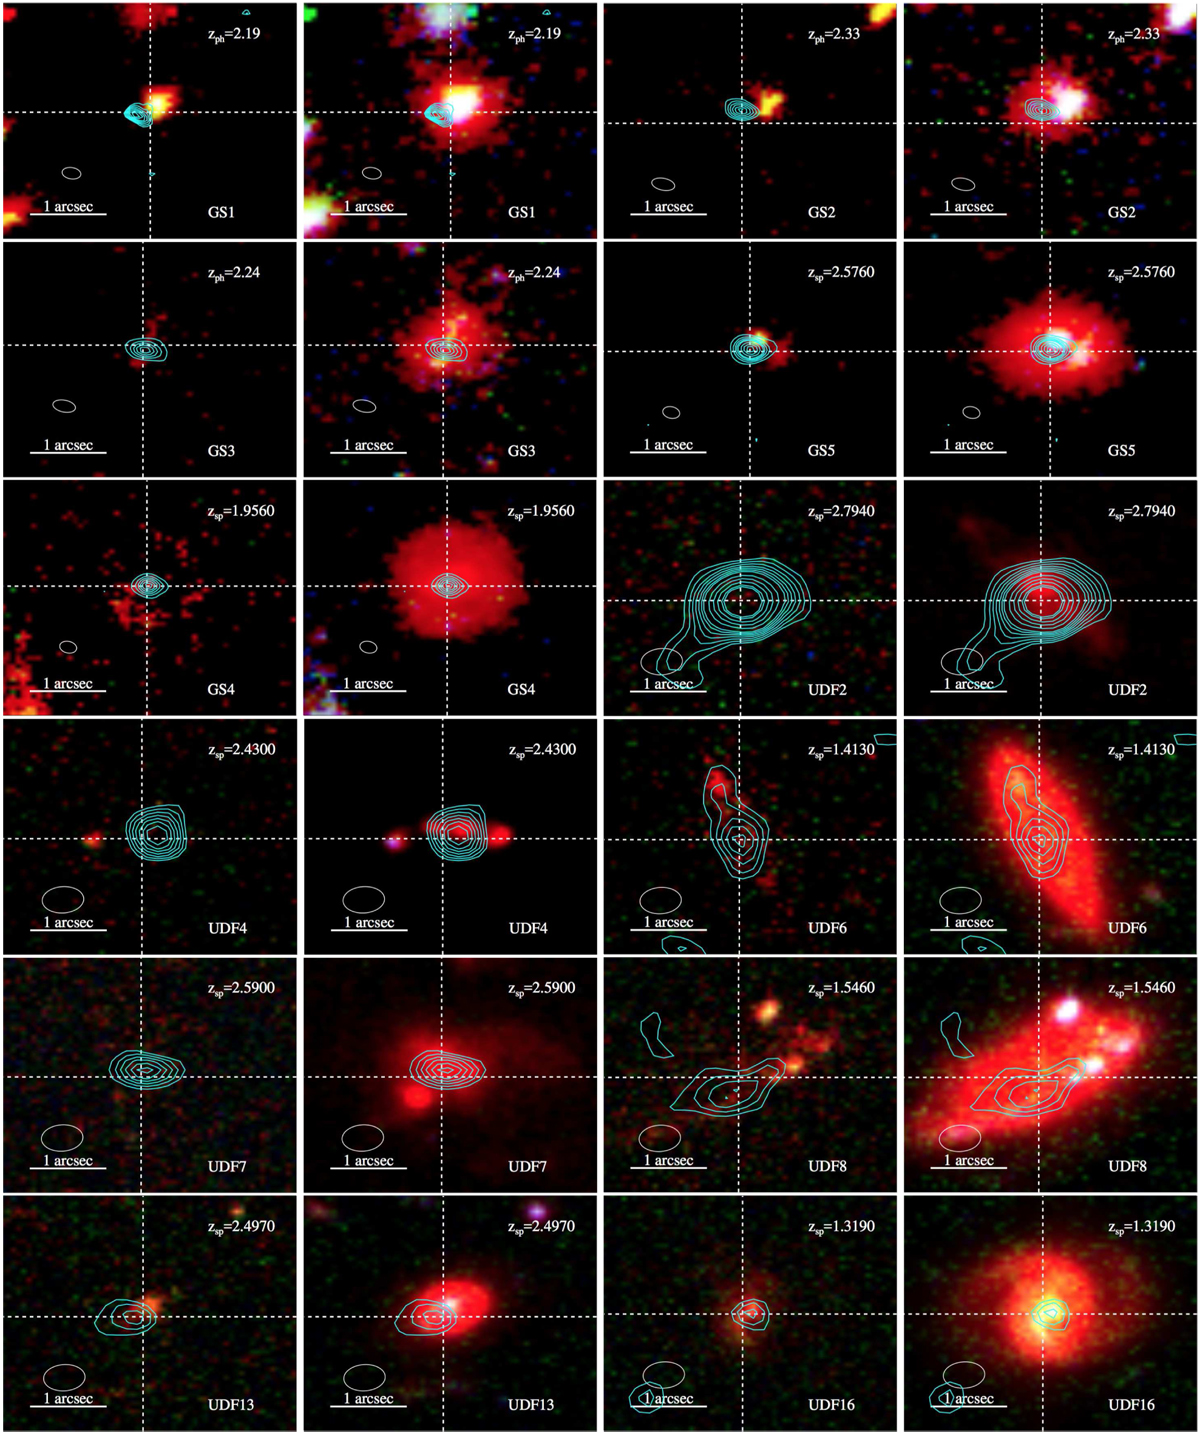
ALMA contours on HST images for MS galaxies. For each galaxy, the left column shows the rest-frame UV from ACS F606W and F814W (equivalent to 2020 and 2710 Å rest-frame at z ~ 2), whereas the right column includes the HST–WFC3 F160W band (1.6 μm) sampling therest-frame 5300 Å band at z ~ 2 (here RGB = V, I, H). The ALMA contours correspond to 1.3 mm for the UDF sources and 870 μm for the GS source. Contours: for the UDF galaxies increase with steps of 0.5σ starting from 2.2σ, for the GS galaxies: 3σ steps up to 14σ, then 21, 29, 36σ. The dashed crosses are centered on the WFC3 F160W band center. The ALMA PSF is shown in the bottom left of each figure.
Current usage metrics show cumulative count of Article Views (full-text article views including HTML views, PDF and ePub downloads, according to the available data) and Abstracts Views on Vision4Press platform.
Data correspond to usage on the plateform after 2015. The current usage metrics is available 48-96 hours after online publication and is updated daily on week days.
Initial download of the metrics may take a while.