Fig. 2
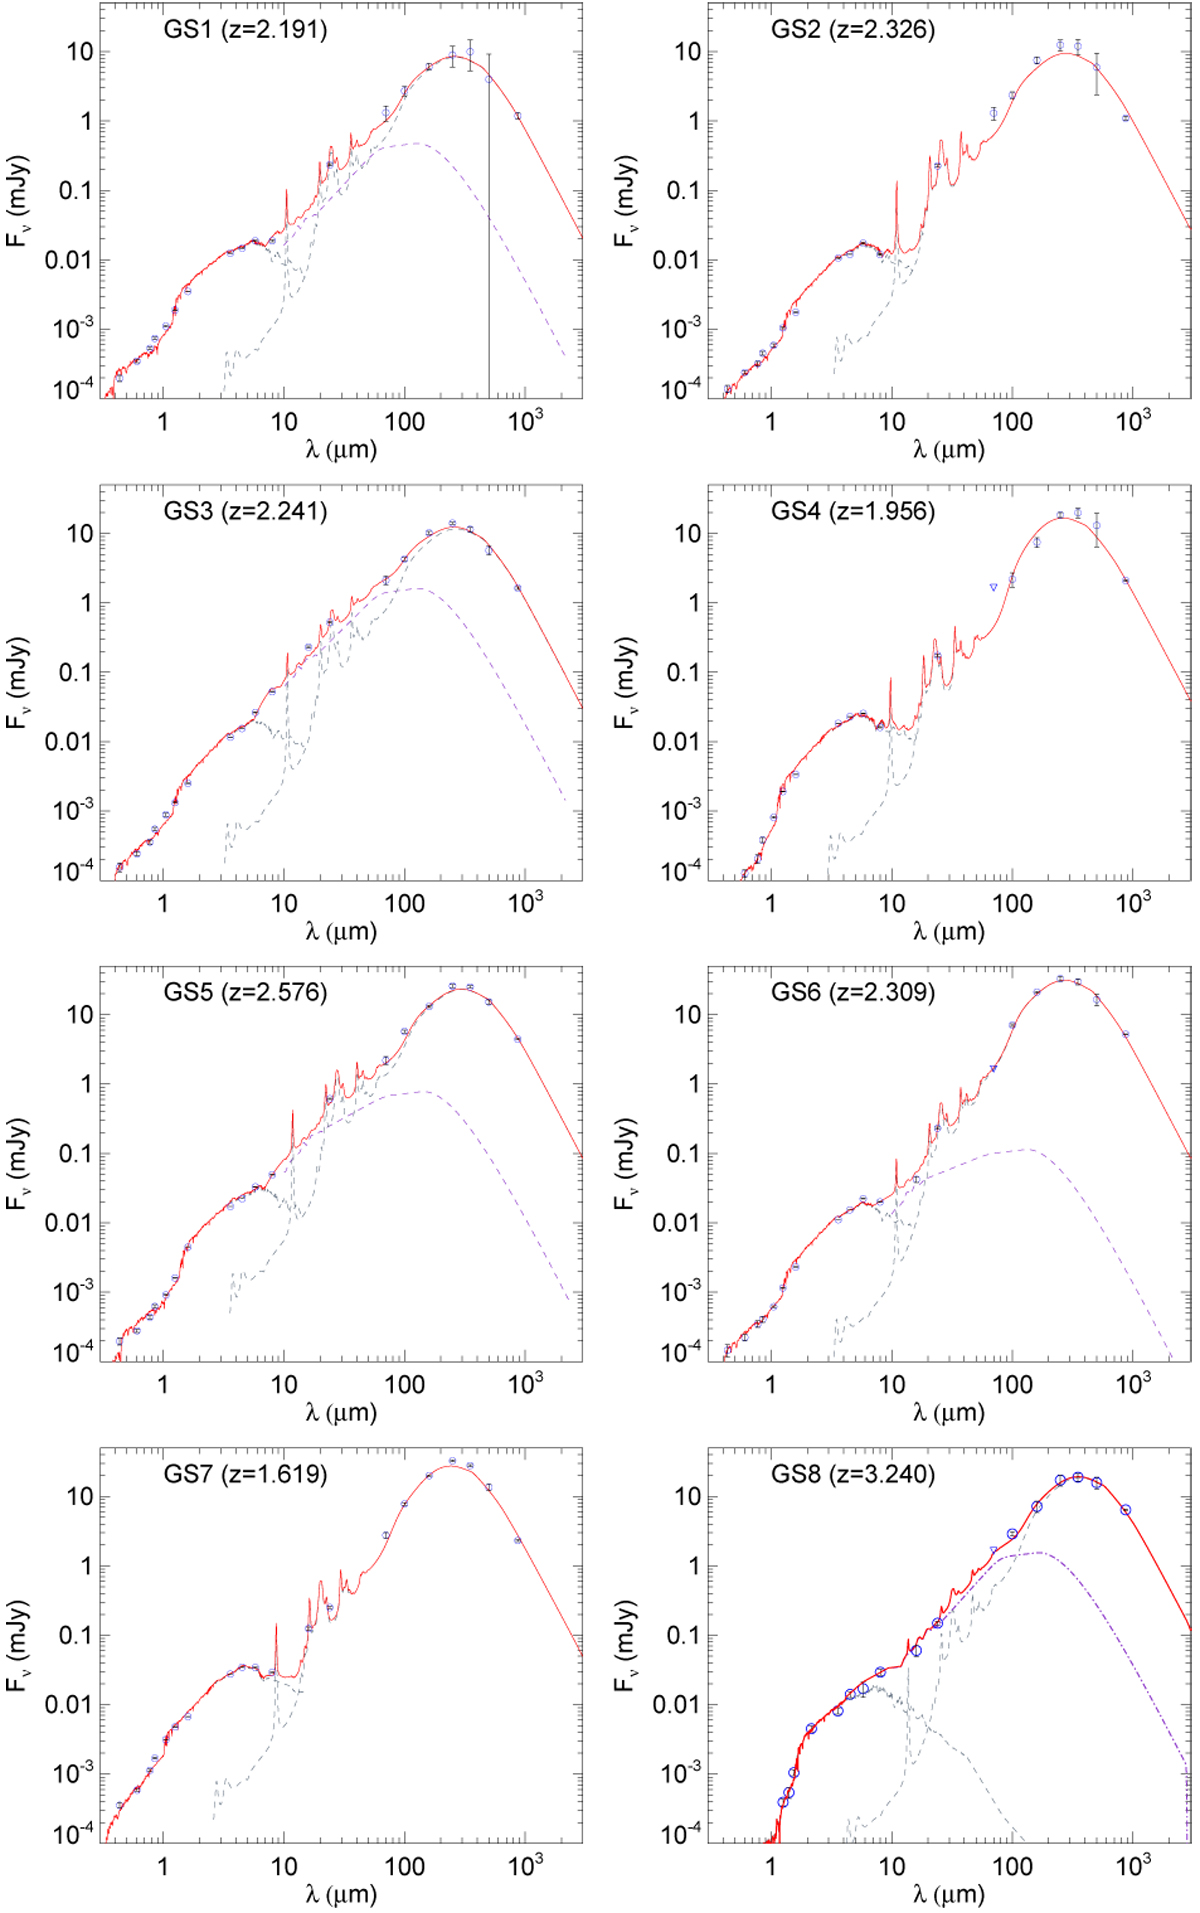
SEDs of the 8 GS galaxies. The solid red line shows the combination of the model fit of the (i) optical-NIR side of the SEDs done with the FAST code, (ii) IR energy distribution from the best-fitting Draine & Li (2007) model (gray dashed line), and when necessary (iii) the warm dust continuum heated by an AGN using the Mullaney et al. (2011) code “decompIR” (purple dashed line). The specific case of GS8, for which the optical counterpart is nearly undetected, is discussed in Sect. 3.1.
Current usage metrics show cumulative count of Article Views (full-text article views including HTML views, PDF and ePub downloads, according to the available data) and Abstracts Views on Vision4Press platform.
Data correspond to usage on the plateform after 2015. The current usage metrics is available 48-96 hours after online publication and is updated daily on week days.
Initial download of the metrics may take a while.