Fig. 17
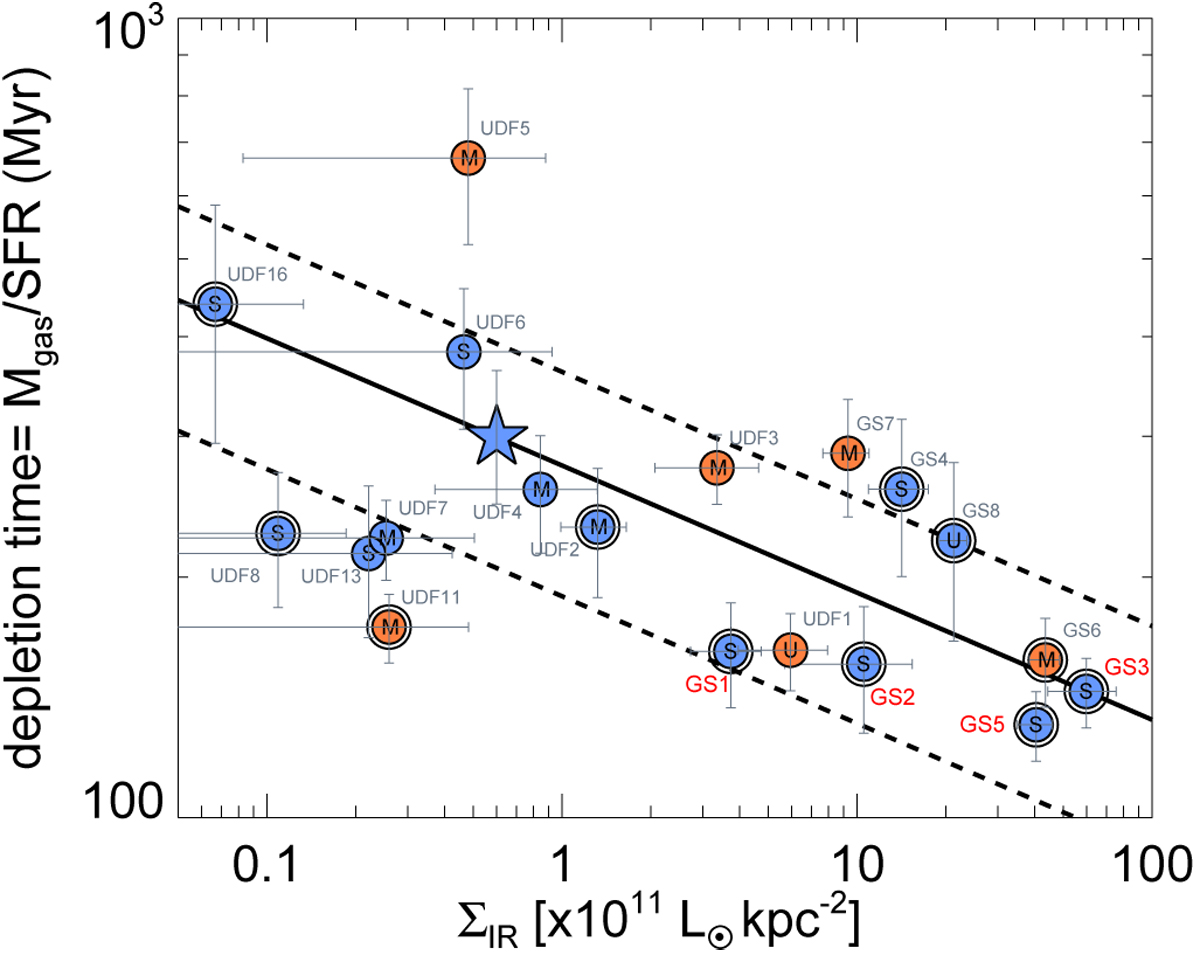
Depletion time as a function IR luminosity surface density, ΣIR. The blue star shows the typical depletion time of z ~ 2.3 MS galaxies. Colors and symbols as in Fig. 14. The four MS galaxies with the shortest depletion times are identified with red labels (GS1, GS2, GS3, and GS5) as in Fig. 13. The solid and dashed lines are the fit to the sliding median and its 68% scatter.
Current usage metrics show cumulative count of Article Views (full-text article views including HTML views, PDF and ePub downloads, according to the available data) and Abstracts Views on Vision4Press platform.
Data correspond to usage on the plateform after 2015. The current usage metrics is available 48-96 hours after online publication and is updated daily on week days.
Initial download of the metrics may take a while.