Fig. 16
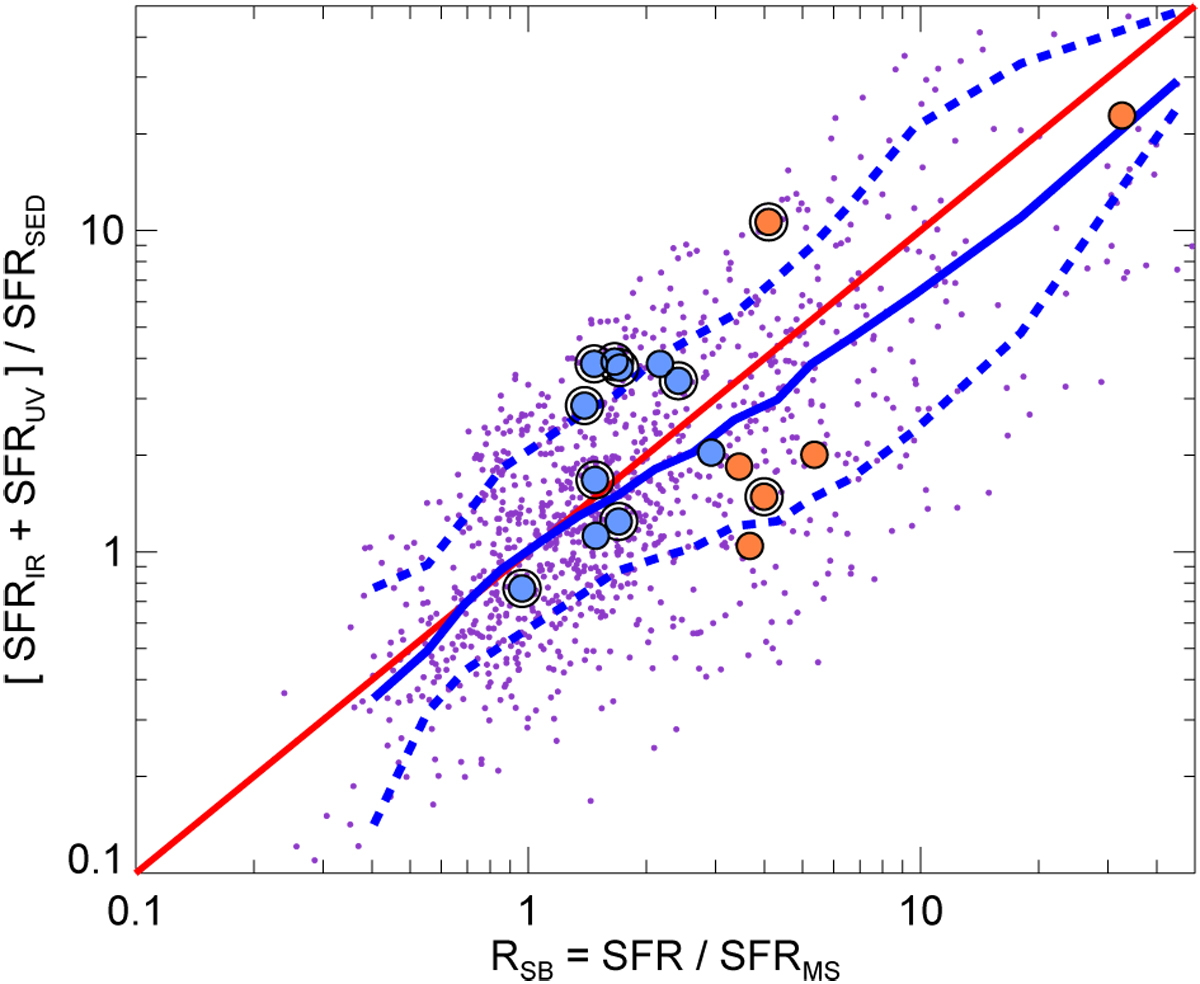
Excess of total SFR, SFRtot = SFRIR+SFRUV, with respect to the SFRSED determined by fitting the rest-frame UV-optical-NIR, as a function of starburstiness, RSB = SFRtot/SFRMS. The purple dots show the positions of the galaxies from all four CANDELS fields with an Herschel detection with 1.5 ≤ z ≤ 2.5. Sliding median of the purple points in thick solid blue line and 68% median absolute deviation in dashed. Symbols for the ALMA galaxies as in Fig. 13. The red line marks the direct proportionality. The solid and dashed blue lines indicate the sliding median and its 68% absolute deviation.
Current usage metrics show cumulative count of Article Views (full-text article views including HTML views, PDF and ePub downloads, according to the available data) and Abstracts Views on Vision4Press platform.
Data correspond to usage on the plateform after 2015. The current usage metrics is available 48-96 hours after online publication and is updated daily on week days.
Initial download of the metrics may take a while.