Fig. 14
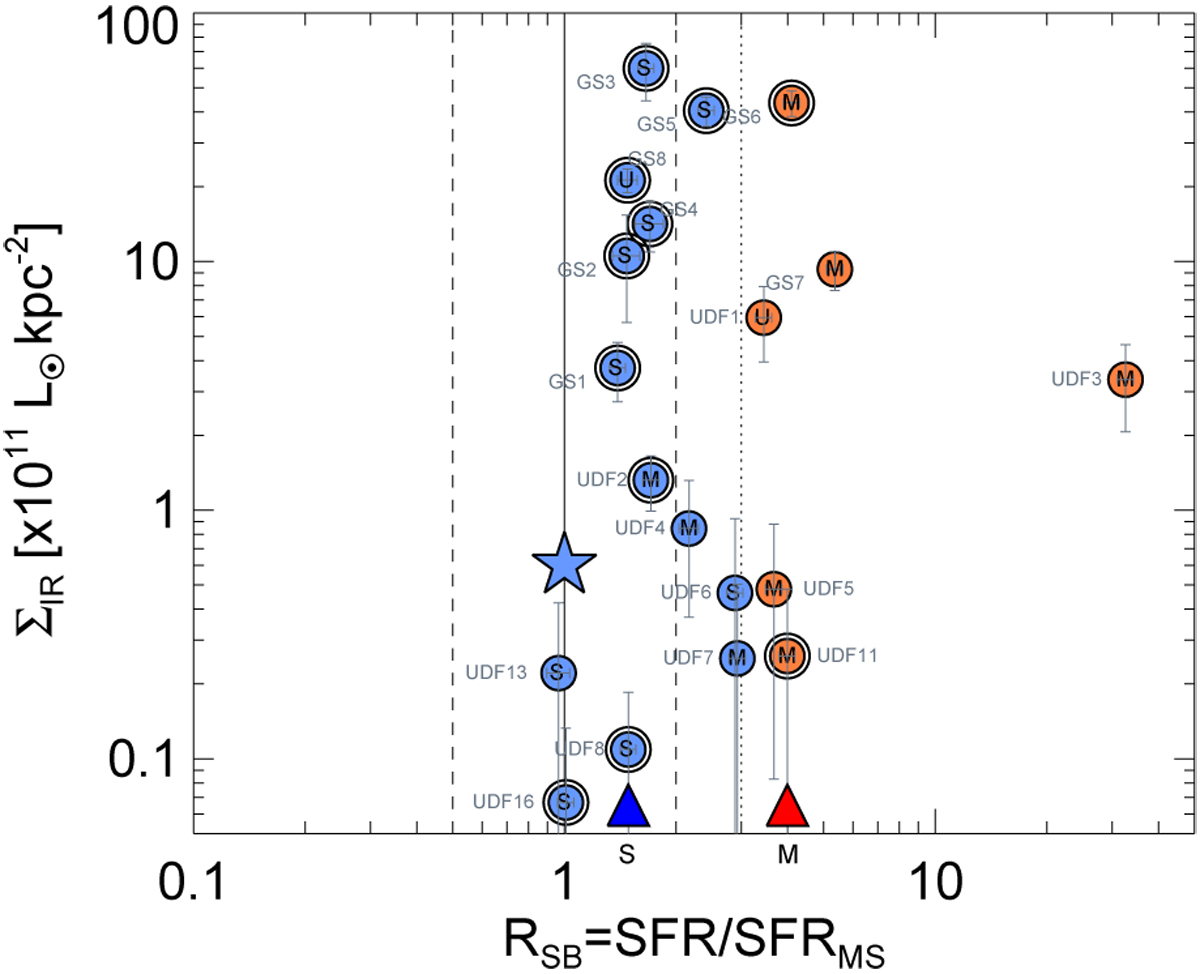
IR luminosity surface density, ΣIR, as a function of starburstiness, RSB. Blue and orange filled dots separate galaxies on and three times above the MS. The letters indicate the morphology. The median position of mergers (M) and “single/isolated” (S) galaxies are indicated at the bottom with a red triangle and a blue triangle, respectively. The blue star shows the position of typical z ~ 2 MS galaxies.The most massive galaxies (M⋆ > 1011 M⊙) are surrounded with an open circle.
Current usage metrics show cumulative count of Article Views (full-text article views including HTML views, PDF and ePub downloads, according to the available data) and Abstracts Views on Vision4Press platform.
Data correspond to usage on the plateform after 2015. The current usage metrics is available 48-96 hours after online publication and is updated daily on week days.
Initial download of the metrics may take a while.