Fig. 13
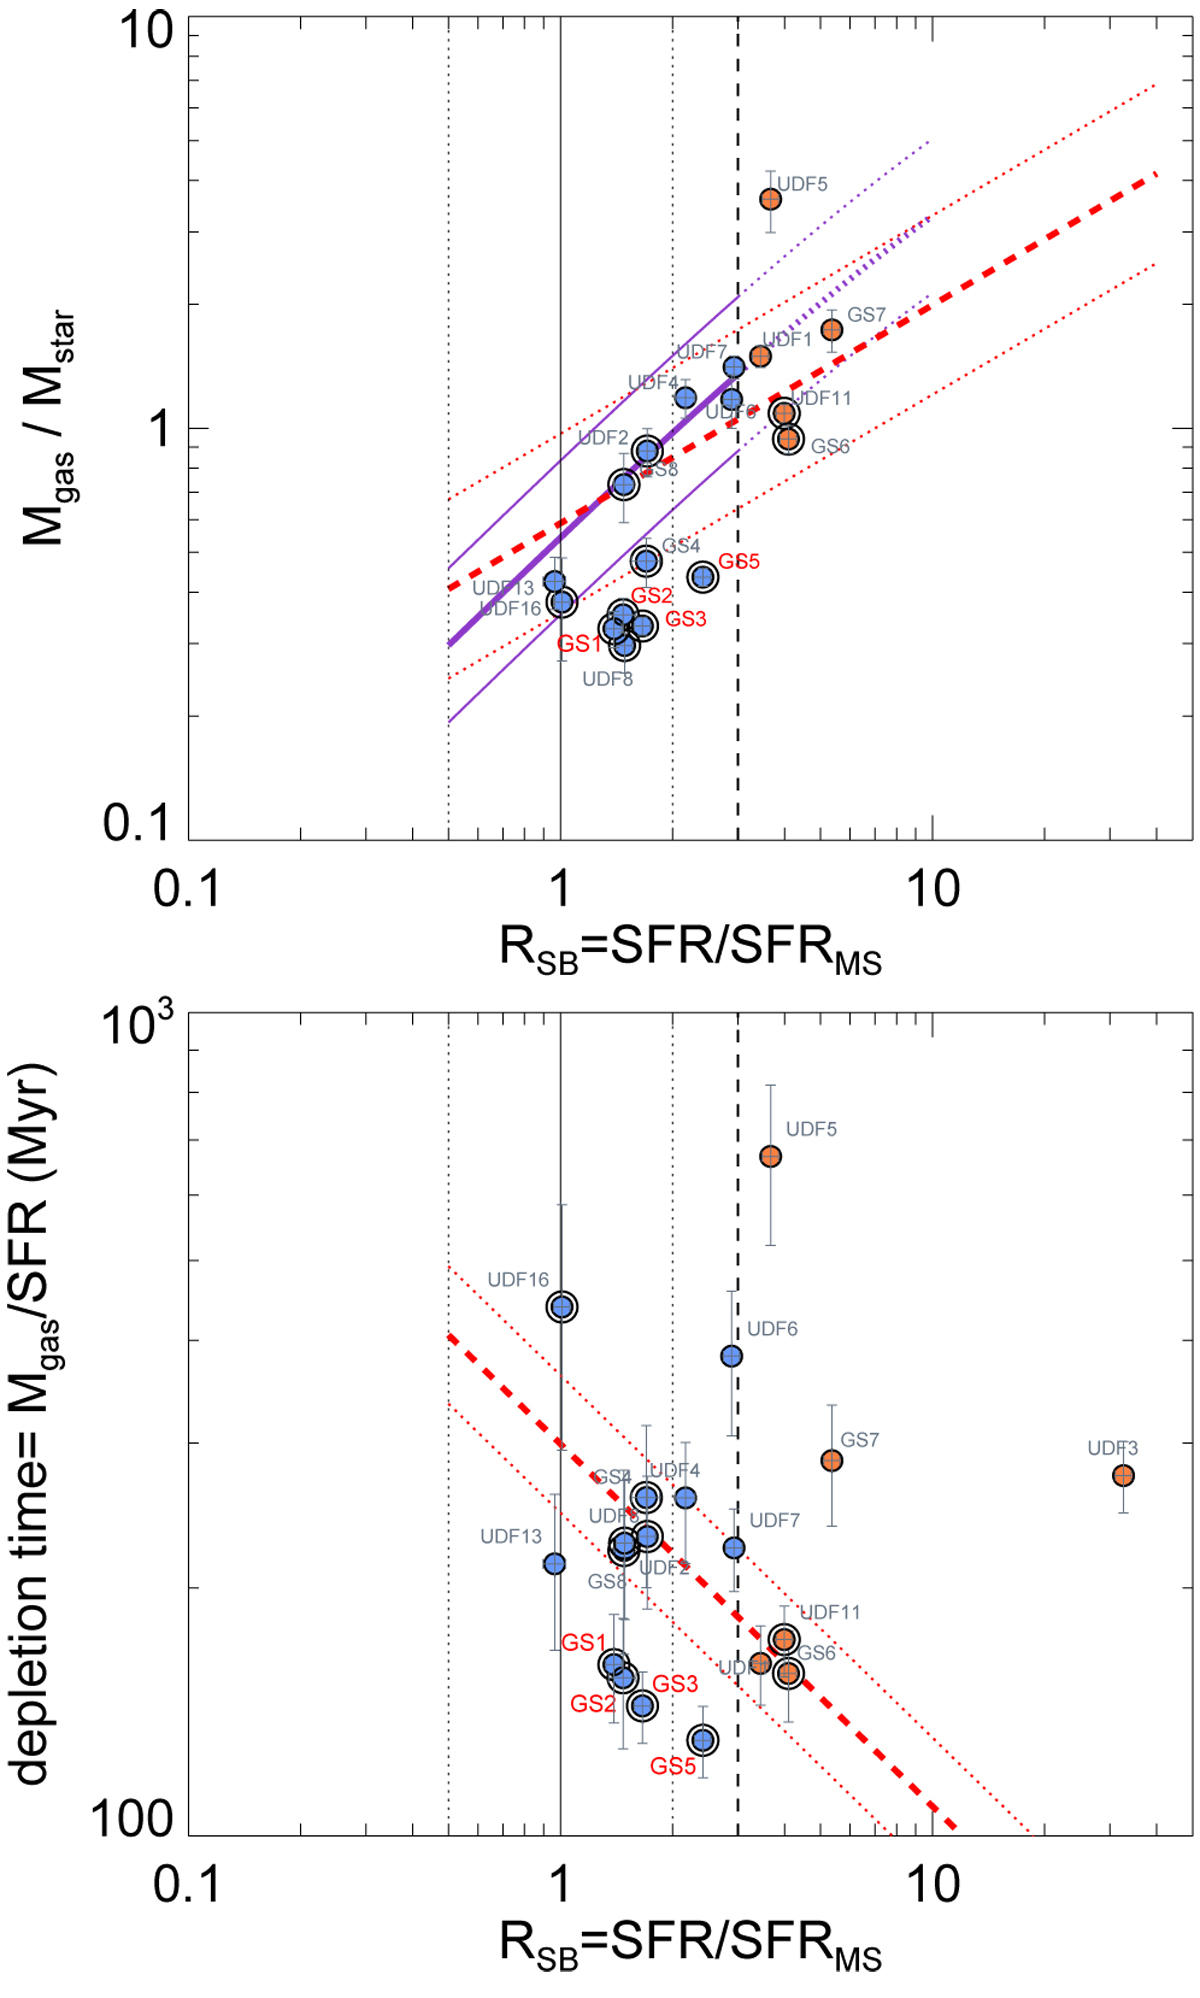
Gas fraction (top) and depletion time (bottom) as a function of starburstiness, RSB = SFR/SFRMS. The MS and its 68% scatter are shown with a solid and dotted lines, respectively. MS galaxies (RSB ≤ 3, left of vertical dashed line) are marked with cyan filled dots; starbursts above the MS (i.e., RSB > 3) with orange filled dots. Galaxies with M⋆ > 1011 M⊙ are surrounded with an open circle. The dashed and dotted red lines show the relations and their scatter obtained by Tacconi et al. (2018) for the median z = 2.3 and ![]() = 1.4 × 10¹¹M⊙ of this galaxy sample (see Eqs. (8) and (9)). The solid purple line in the top figure shows the relationobtained by Magdis et al. (2012a) scaled to the median stellar mass of the sample. The four galaxies with red labels (GS1, GS2, GS3, GS5) present short depletion times typical of starbursts (they are discussed in Sect. 4.4).
= 1.4 × 10¹¹M⊙ of this galaxy sample (see Eqs. (8) and (9)). The solid purple line in the top figure shows the relationobtained by Magdis et al. (2012a) scaled to the median stellar mass of the sample. The four galaxies with red labels (GS1, GS2, GS3, GS5) present short depletion times typical of starbursts (they are discussed in Sect. 4.4).
Current usage metrics show cumulative count of Article Views (full-text article views including HTML views, PDF and ePub downloads, according to the available data) and Abstracts Views on Vision4Press platform.
Data correspond to usage on the plateform after 2015. The current usage metrics is available 48-96 hours after online publication and is updated daily on week days.
Initial download of the metrics may take a while.