Fig. 12
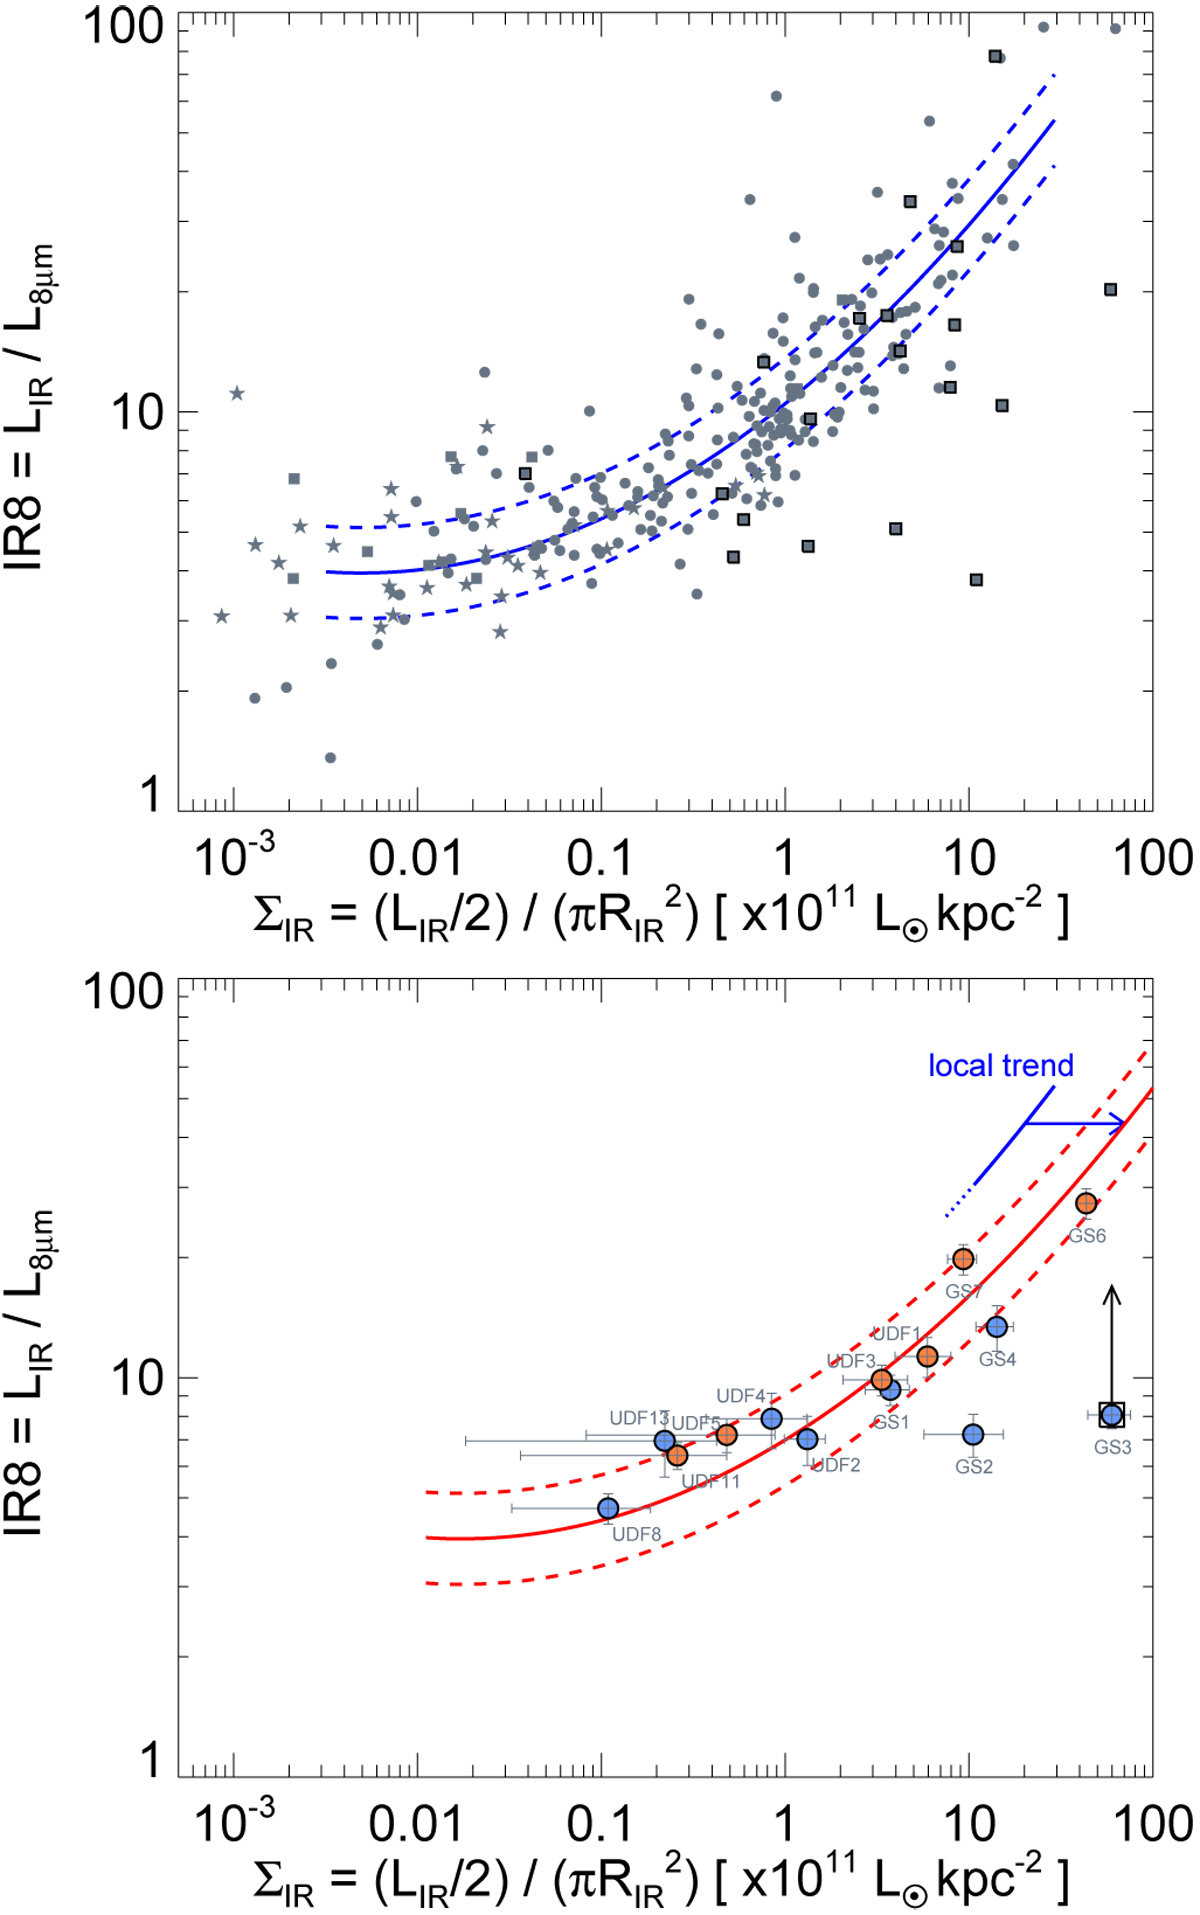
Top: IR8 – ΣIR relation for local galaxies. Gray filled dots: 293 galaxies with Herschel PACS 70 μm sizes (RIR = R70 μm) from Díaz-Santos et al. (2017). Filled squares and stars: 11 and 39 galaxies with radio and MIR sizes from Elbaz et al. (2011). Galaxies with MIR spectral signatures of AGNs (identified by Díaz-Santos et al. 2017) are marked with bold squares. The solid blue line is a polynomial fit to the sliding median described by Eq. (7). The two dashed lines 30% above and below (±0.11 dex) encompass 68% of the galaxies. Bottom: position of the z ~ 2 ALMA sources on the IR8 – ΣIR diagram. The solid and dashed red lines show the local relation shifted to the right by a factor 3.5 to account for the combined effects of the rise of the MS SFR with redshift and decrease of galaxy sizes with redshift. Blue and orange filled dots separate galaxies on or close to the MS (RSB ≤ 3) from starbursts (RSB > 3). Only galaxies within 1.5 ≤ z ≤ 2.5 are shown here because of a large and uncertain extrapolation of L8 from the observed 24 μm flux density for galaxies outside this redshift range. The black square on GS3 indicates that it is a power-law for which the contribution of the AGN has been corrected in a conservative way.
Current usage metrics show cumulative count of Article Views (full-text article views including HTML views, PDF and ePub downloads, according to the available data) and Abstracts Views on Vision4Press platform.
Data correspond to usage on the plateform after 2015. The current usage metrics is available 48-96 hours after online publication and is updated daily on week days.
Initial download of the metrics may take a while.