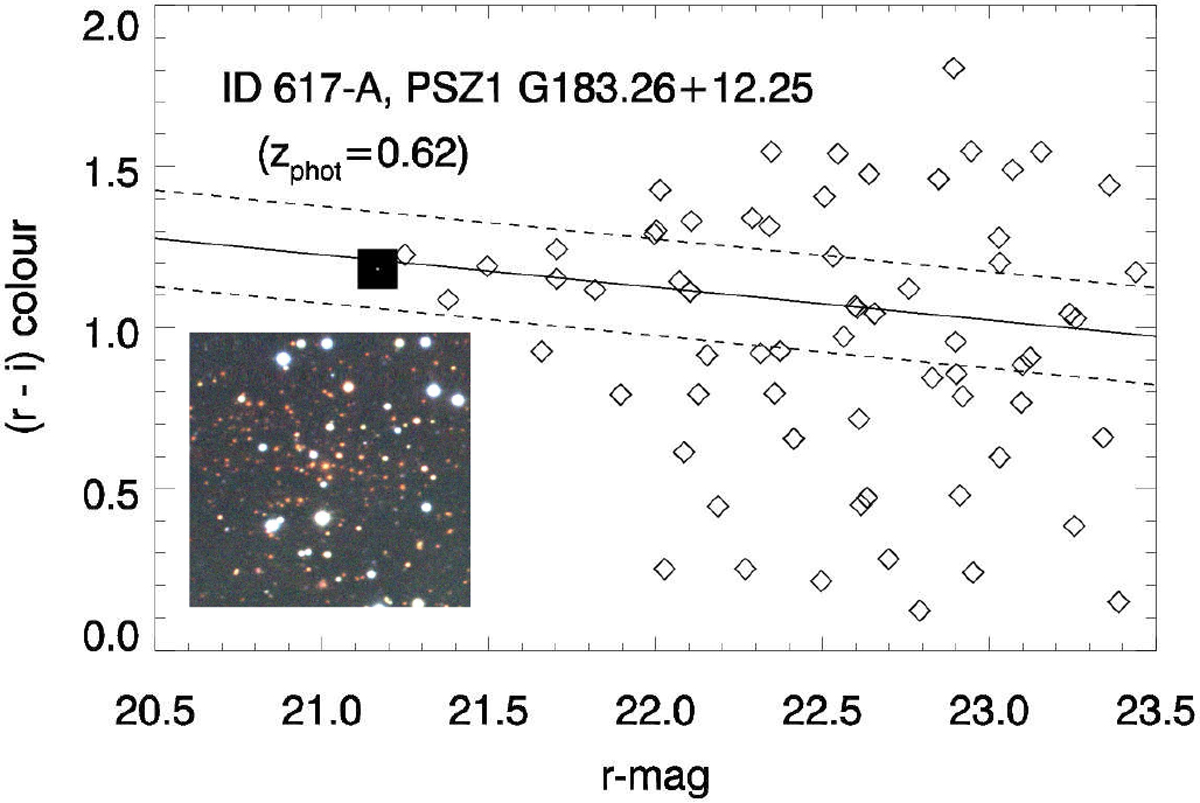
Fig. 2

(r′− i′,r′) CMD of ID 617-A, associated with PSZ1 the source G183.26+12.25. The diagramconsiders extended sources within a region of 2.′5 × 2.′5 (1 × 1 Mpc) around the BCG of the system (represented by the large filled square in the plot). The solid line represents the fitted RS, which yields zphot = 0.62. Dashed linescorrespond to the RS±0.15 locus, where likely cluster members are selected. An RGB image (composed using the g′, r′ and i′ frames) showing the 2.′5 × 2.′5 inner region of this cluster is superimposed on the plot.
Current usage metrics show cumulative count of Article Views (full-text article views including HTML views, PDF and ePub downloads, according to the available data) and Abstracts Views on Vision4Press platform.
Data correspond to usage on the plateform after 2015. The current usage metrics is available 48-96 hours after online publication and is updated daily on week days.
Initial download of the metrics may take a while.


