Fig. 7.
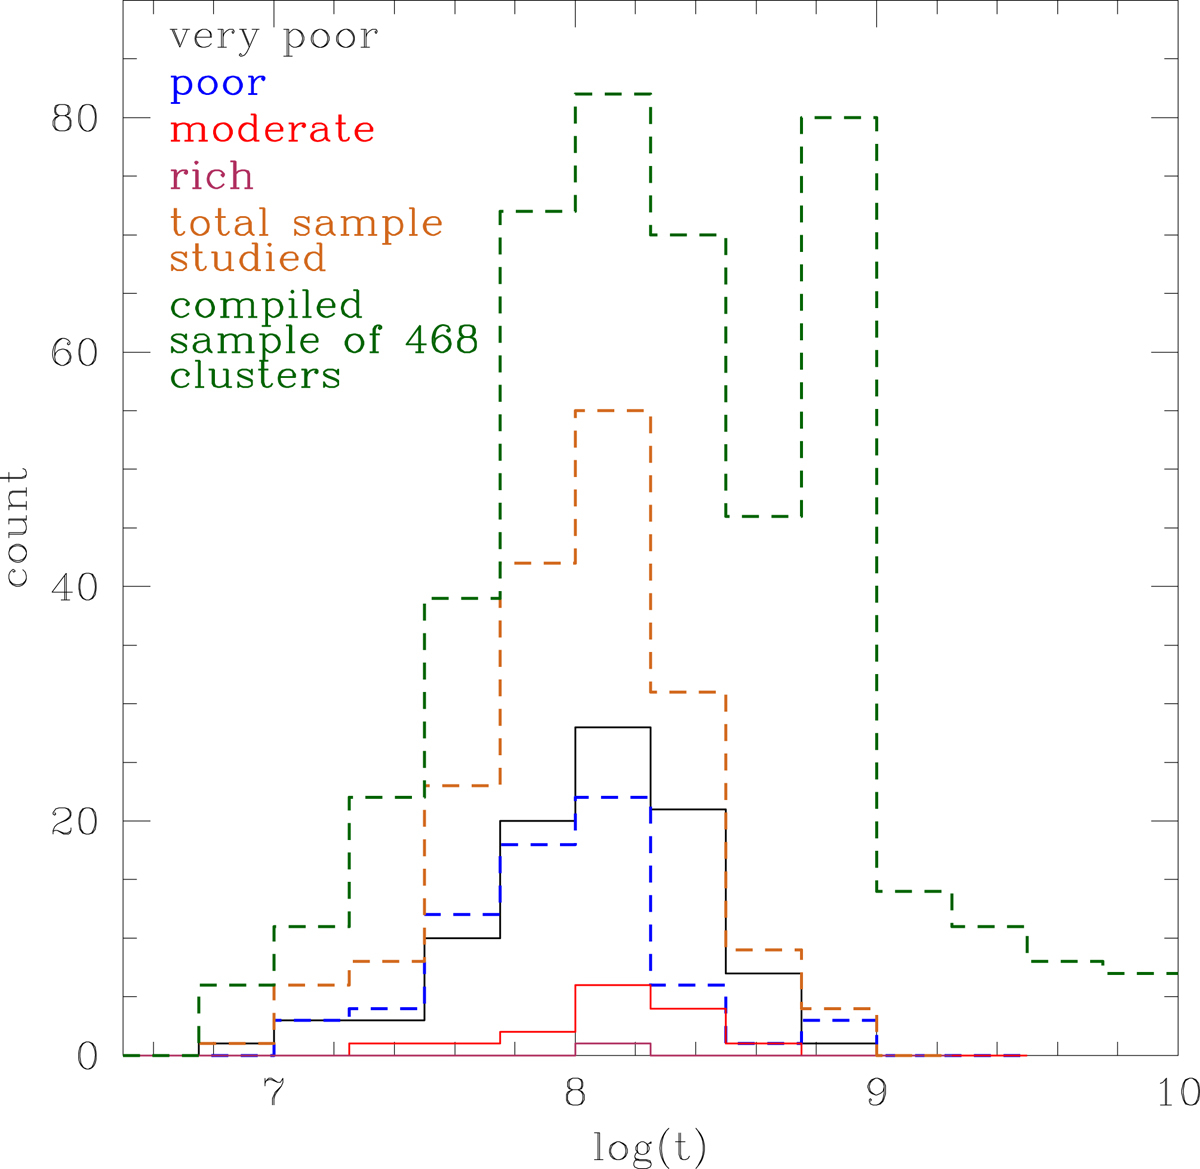
Age distribution of very poor (black), poor (blue), moderate (red), and rich (maroon) clusters. Distributions of all the four groups of clusters peak in the range of log(t) = 8.00–8.25. Cumulative age distribution of all the studied clusters (chocolate) shows a peak at ~130 ± 35 Myr. Age distribution of the compiled sample of 468 clusters peaks at ~130 and ~750 Myr.
Current usage metrics show cumulative count of Article Views (full-text article views including HTML views, PDF and ePub downloads, according to the available data) and Abstracts Views on Vision4Press platform.
Data correspond to usage on the plateform after 2015. The current usage metrics is available 48-96 hours after online publication and is updated daily on week days.
Initial download of the metrics may take a while.