Fig. 3.
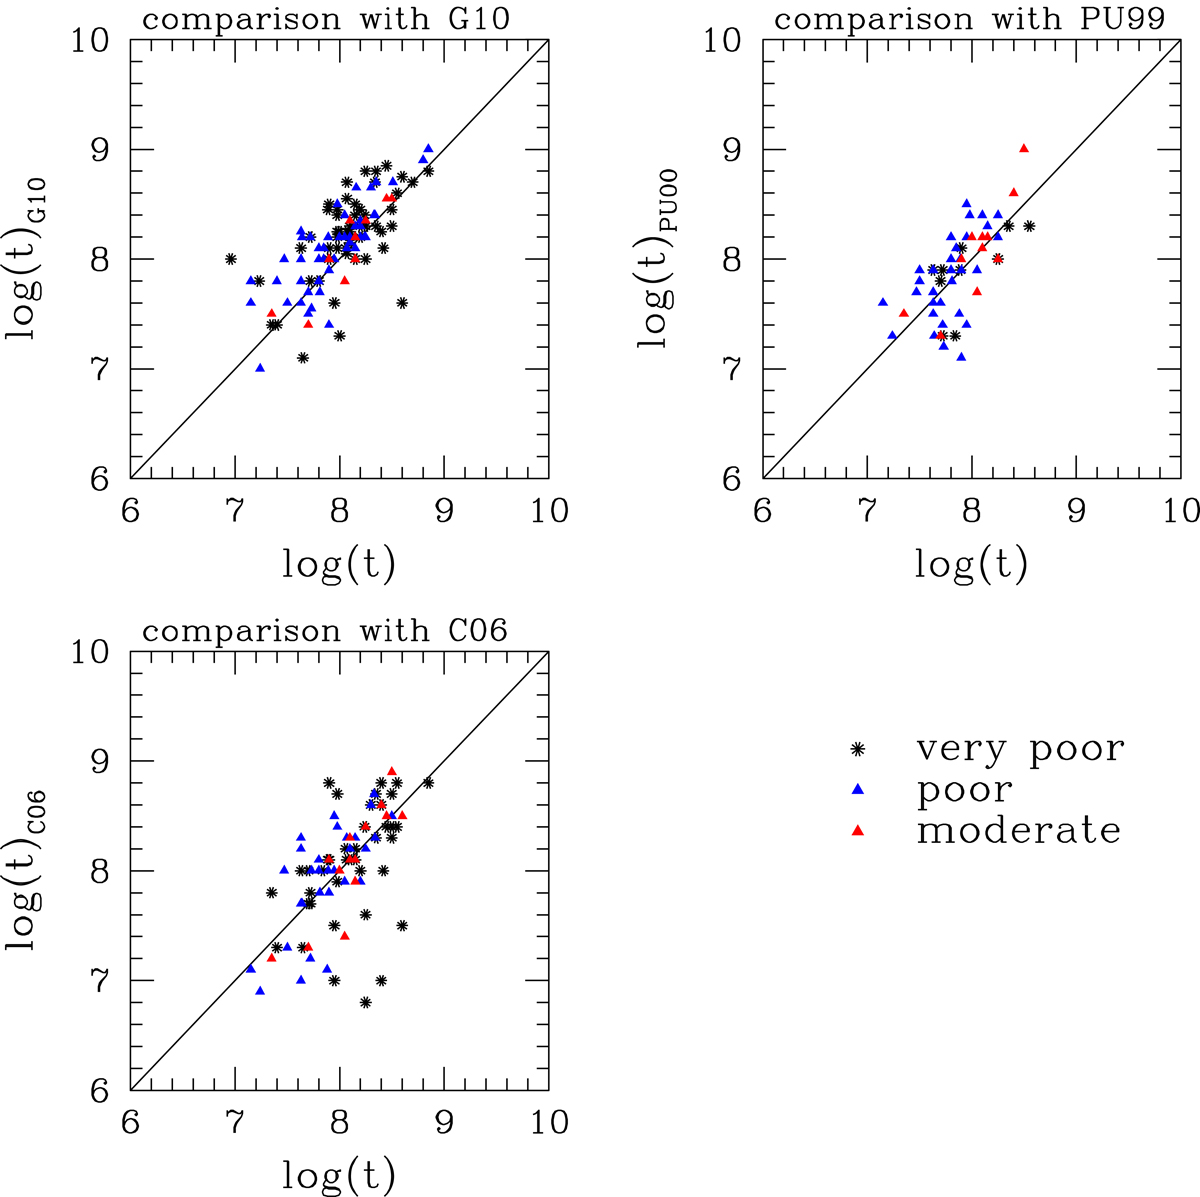
Comparison between our estimated age (X-axis) and age estimated by previous studies (Y-axis). We have compared our age estimation with that of G10 (top left), PU99 (top right) and C06 (bottom one). Different point types indicate clusters from different group of classification. A straight line with slope = 1 is shown in each plot to indicate the deviation in the estimated age.
Current usage metrics show cumulative count of Article Views (full-text article views including HTML views, PDF and ePub downloads, according to the available data) and Abstracts Views on Vision4Press platform.
Data correspond to usage on the plateform after 2015. The current usage metrics is available 48-96 hours after online publication and is updated daily on week days.
Initial download of the metrics may take a while.