Fig. 4.
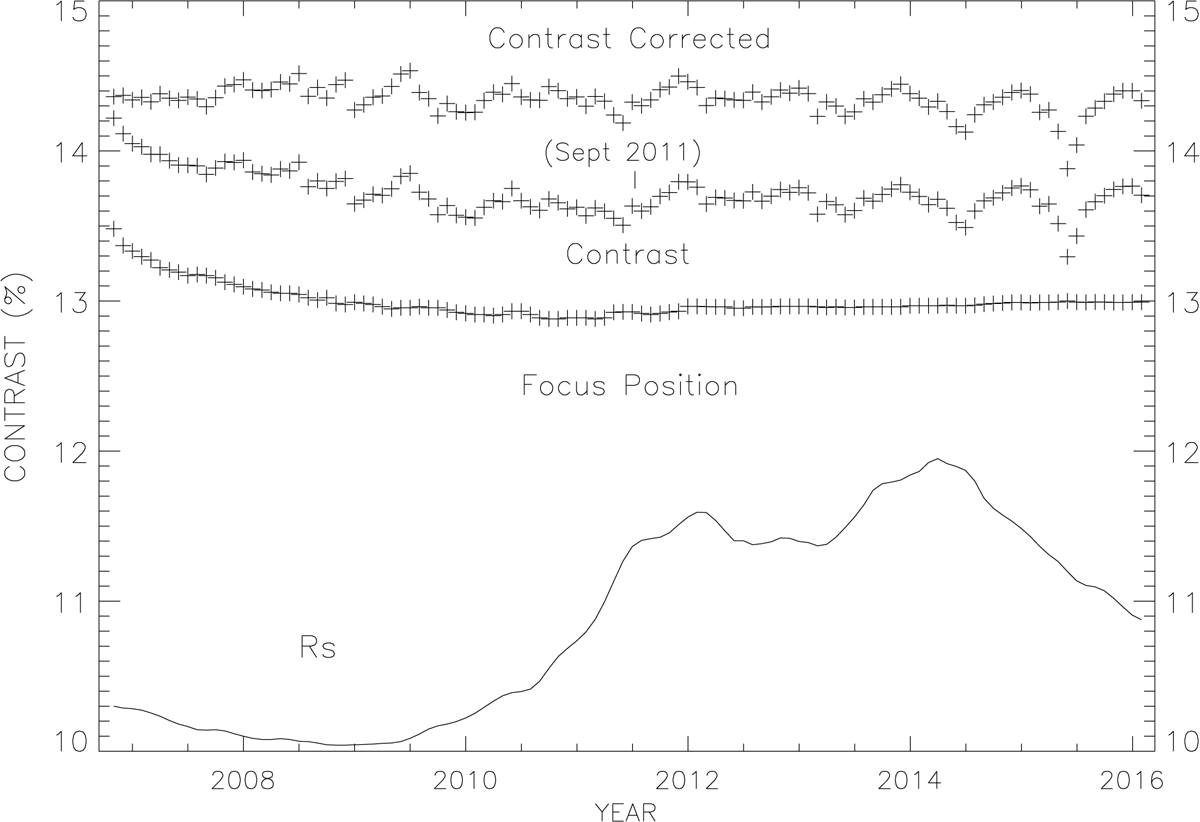
Variations of the granulation contrast (middle), of the focus position transformed in contrast with the help of the linear relation in Fig. 3 (bottom), of the granulation contrast corrected by the variation of the focus position (top) and of the smoothed sunspot index. Each cross represents a monthly average. All variations are artificially shifted for clarity.
Current usage metrics show cumulative count of Article Views (full-text article views including HTML views, PDF and ePub downloads, according to the available data) and Abstracts Views on Vision4Press platform.
Data correspond to usage on the plateform after 2015. The current usage metrics is available 48-96 hours after online publication and is updated daily on week days.
Initial download of the metrics may take a while.