Fig. 3.
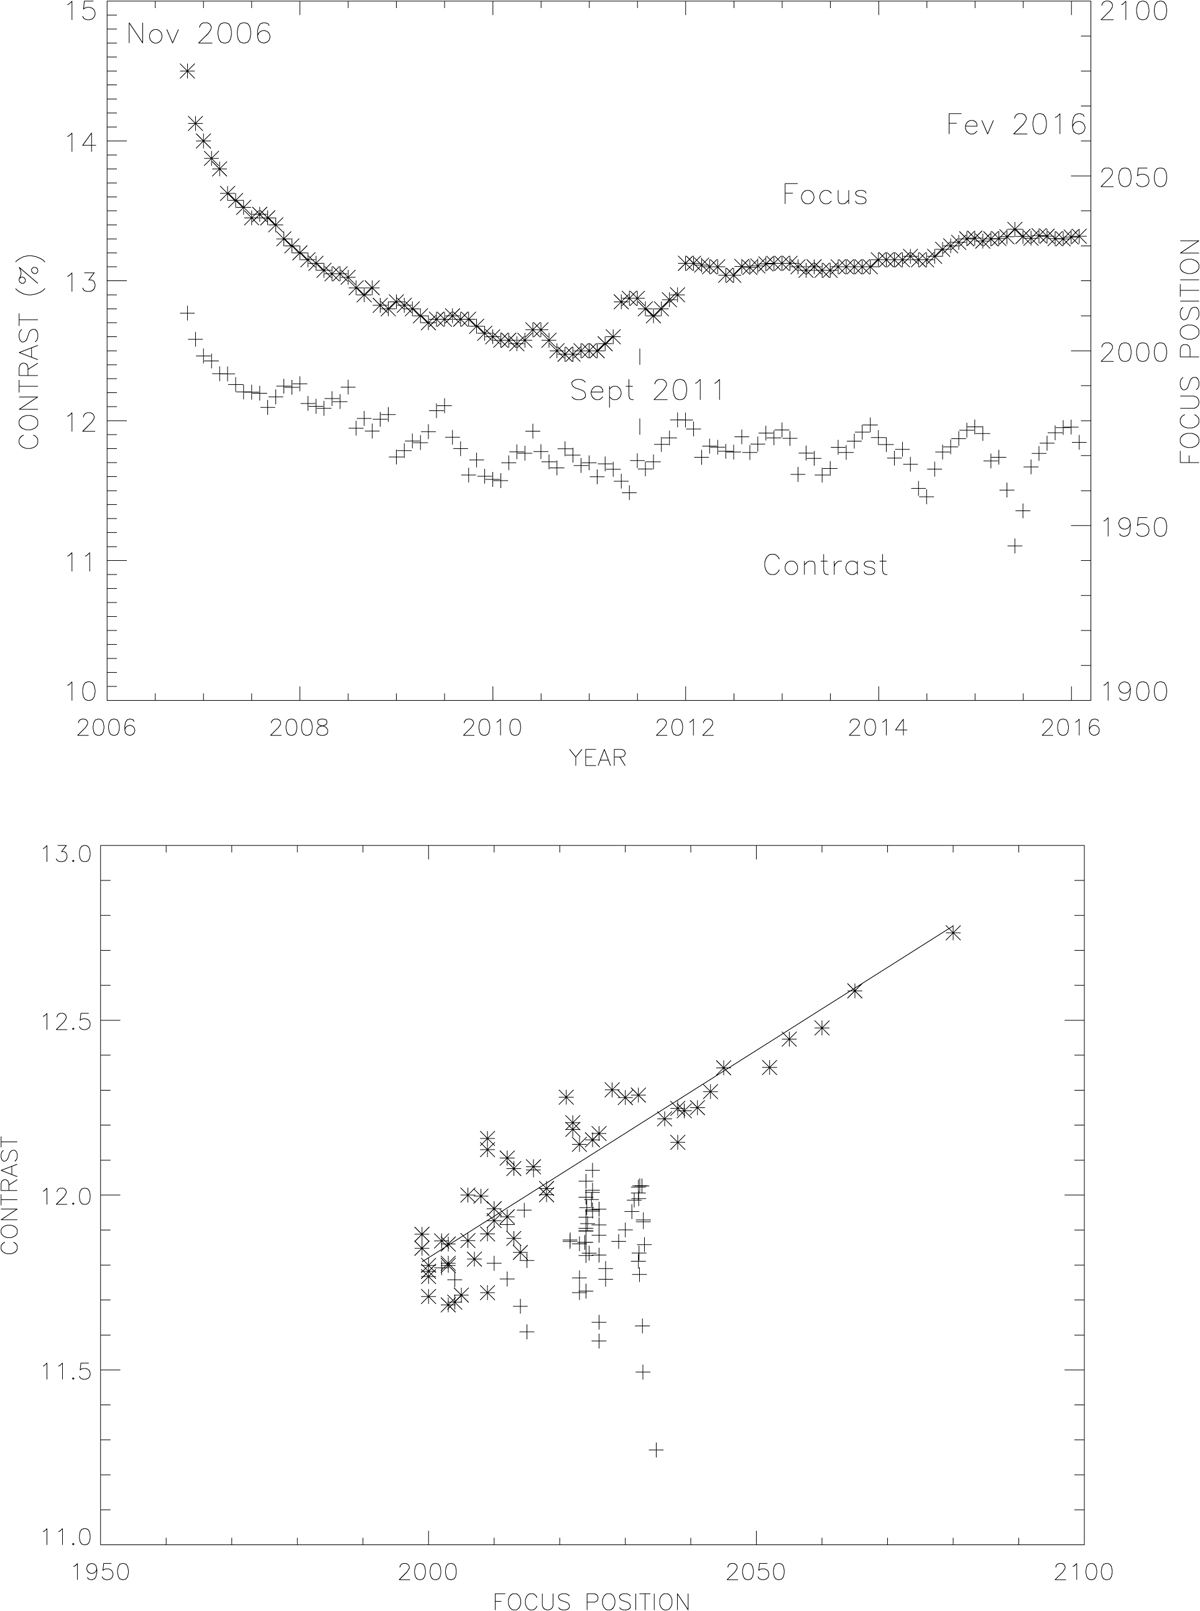
Top: variation of the granulation contrast (+) and of the focus position (*) of the selected images, during the period of observation November 2006–February 2016; each cross and each star represents a monthly average. Bottom: correlation between contrast and focus position. (*): for the period November 2006–December 2010; (+): for the period January 2011–February 2016.
Current usage metrics show cumulative count of Article Views (full-text article views including HTML views, PDF and ePub downloads, according to the available data) and Abstracts Views on Vision4Press platform.
Data correspond to usage on the plateform after 2015. The current usage metrics is available 48-96 hours after online publication and is updated daily on week days.
Initial download of the metrics may take a while.