Fig. 2.
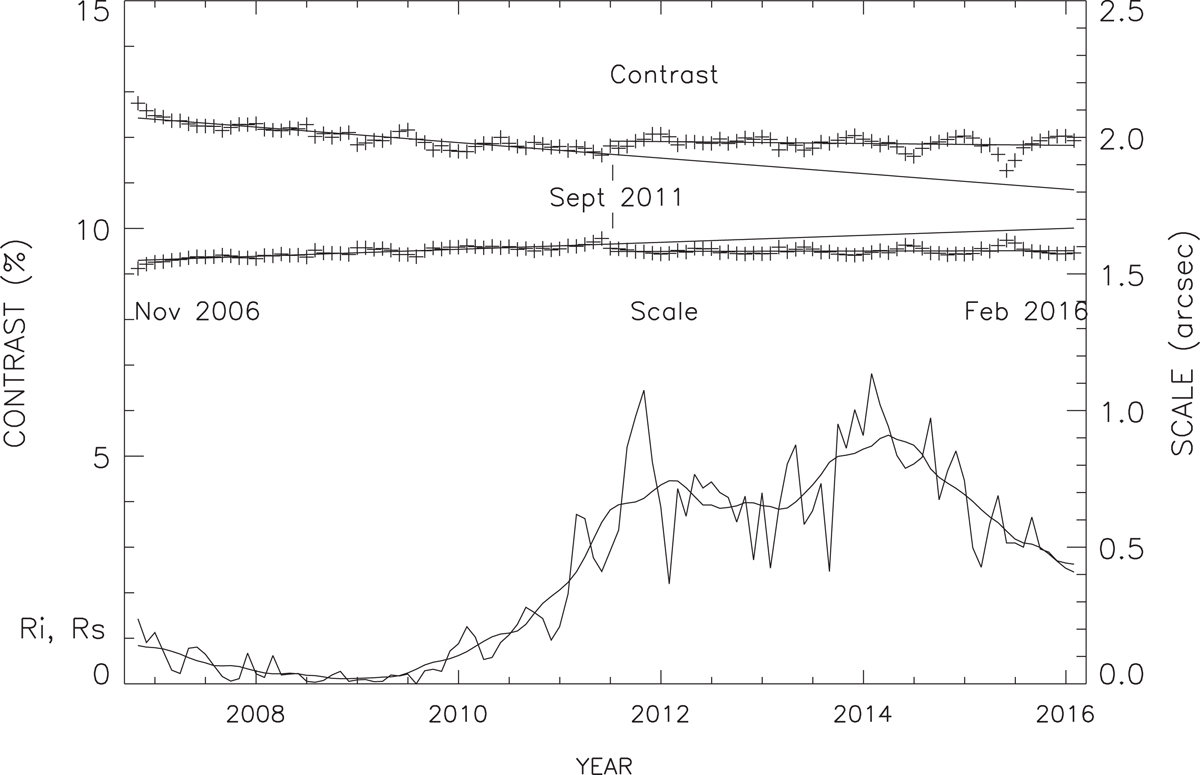
Variation of the granulation contrast (+) and scale (+) at the disk center, corrected from the annual variation of the distance Earth-Sun, between November 2006 and February 2016; each cross represents a monthly average. Linear trends before and after September 2011 are overplotted. Ri and Rs are the Monthly Sunspot Index and the Smoothed Sunspot Index respectively, published by the SIDC (of the Royal Observatory of Belgium), divided by 20 in order to enter into the Contrast y-axis of the figure.
Current usage metrics show cumulative count of Article Views (full-text article views including HTML views, PDF and ePub downloads, according to the available data) and Abstracts Views on Vision4Press platform.
Data correspond to usage on the plateform after 2015. The current usage metrics is available 48-96 hours after online publication and is updated daily on week days.
Initial download of the metrics may take a while.