Open Access
Fig. 17
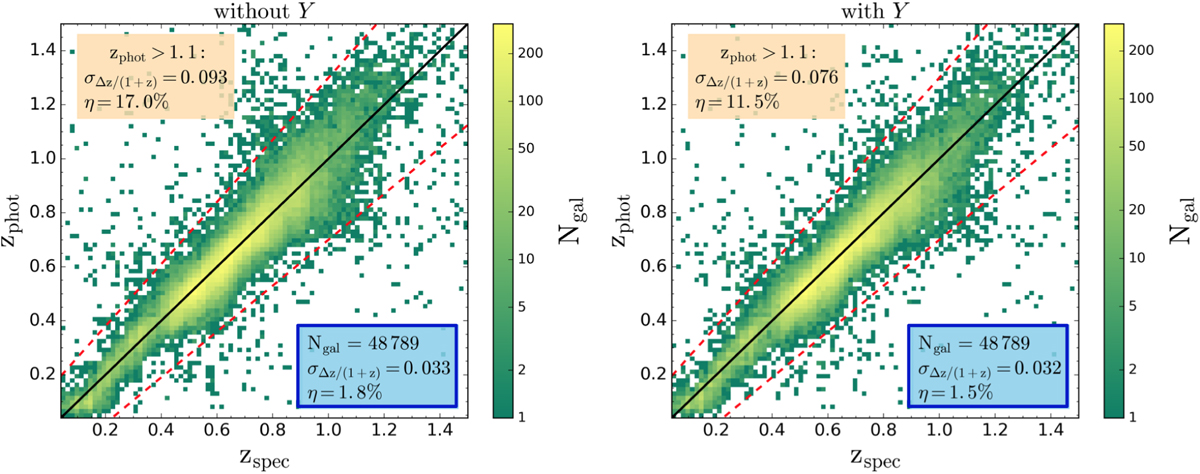
Comparison between the photometric and spectroscopic redshifts of our sample, with i’-band magnitude at 15.0 < i’ < 25.0. The red dashed lines correspond to the outlier limit beyond which σΔz∕(1+z) > 0.15.
Current usage metrics show cumulative count of Article Views (full-text article views including HTML views, PDF and ePub downloads, according to the available data) and Abstracts Views on Vision4Press platform.
Data correspond to usage on the plateform after 2015. The current usage metrics is available 48-96 hours after online publication and is updated daily on week days.
Initial download of the metrics may take a while.