Open Access
Fig. 12
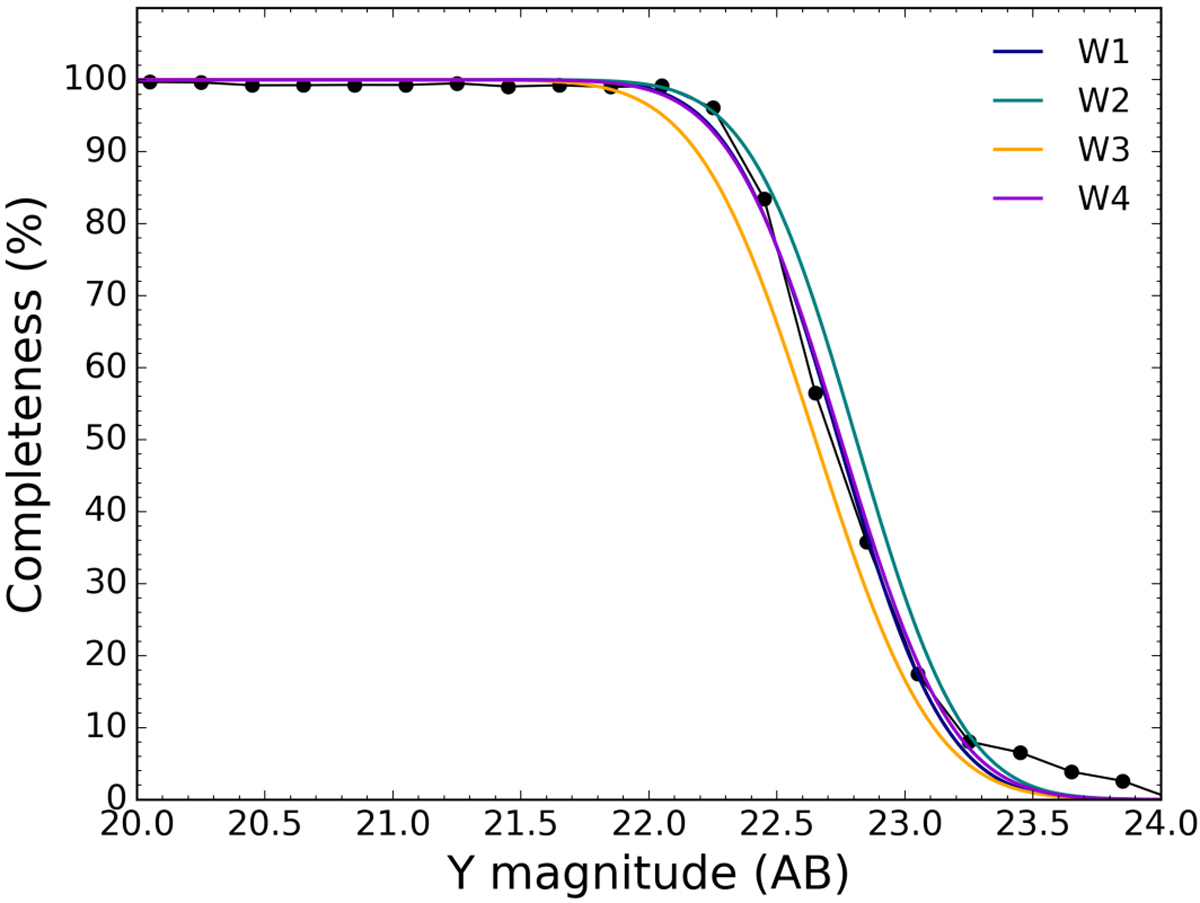
Point source completeness rate as a function of magnitude for each of the four CFHQSIR fields. The coloured lines correspond to fits of the data points with complementary error functions and the black filled circles are the data points for the W1 field.
Current usage metrics show cumulative count of Article Views (full-text article views including HTML views, PDF and ePub downloads, according to the available data) and Abstracts Views on Vision4Press platform.
Data correspond to usage on the plateform after 2015. The current usage metrics is available 48-96 hours after online publication and is updated daily on week days.
Initial download of the metrics may take a while.