Fig. 9
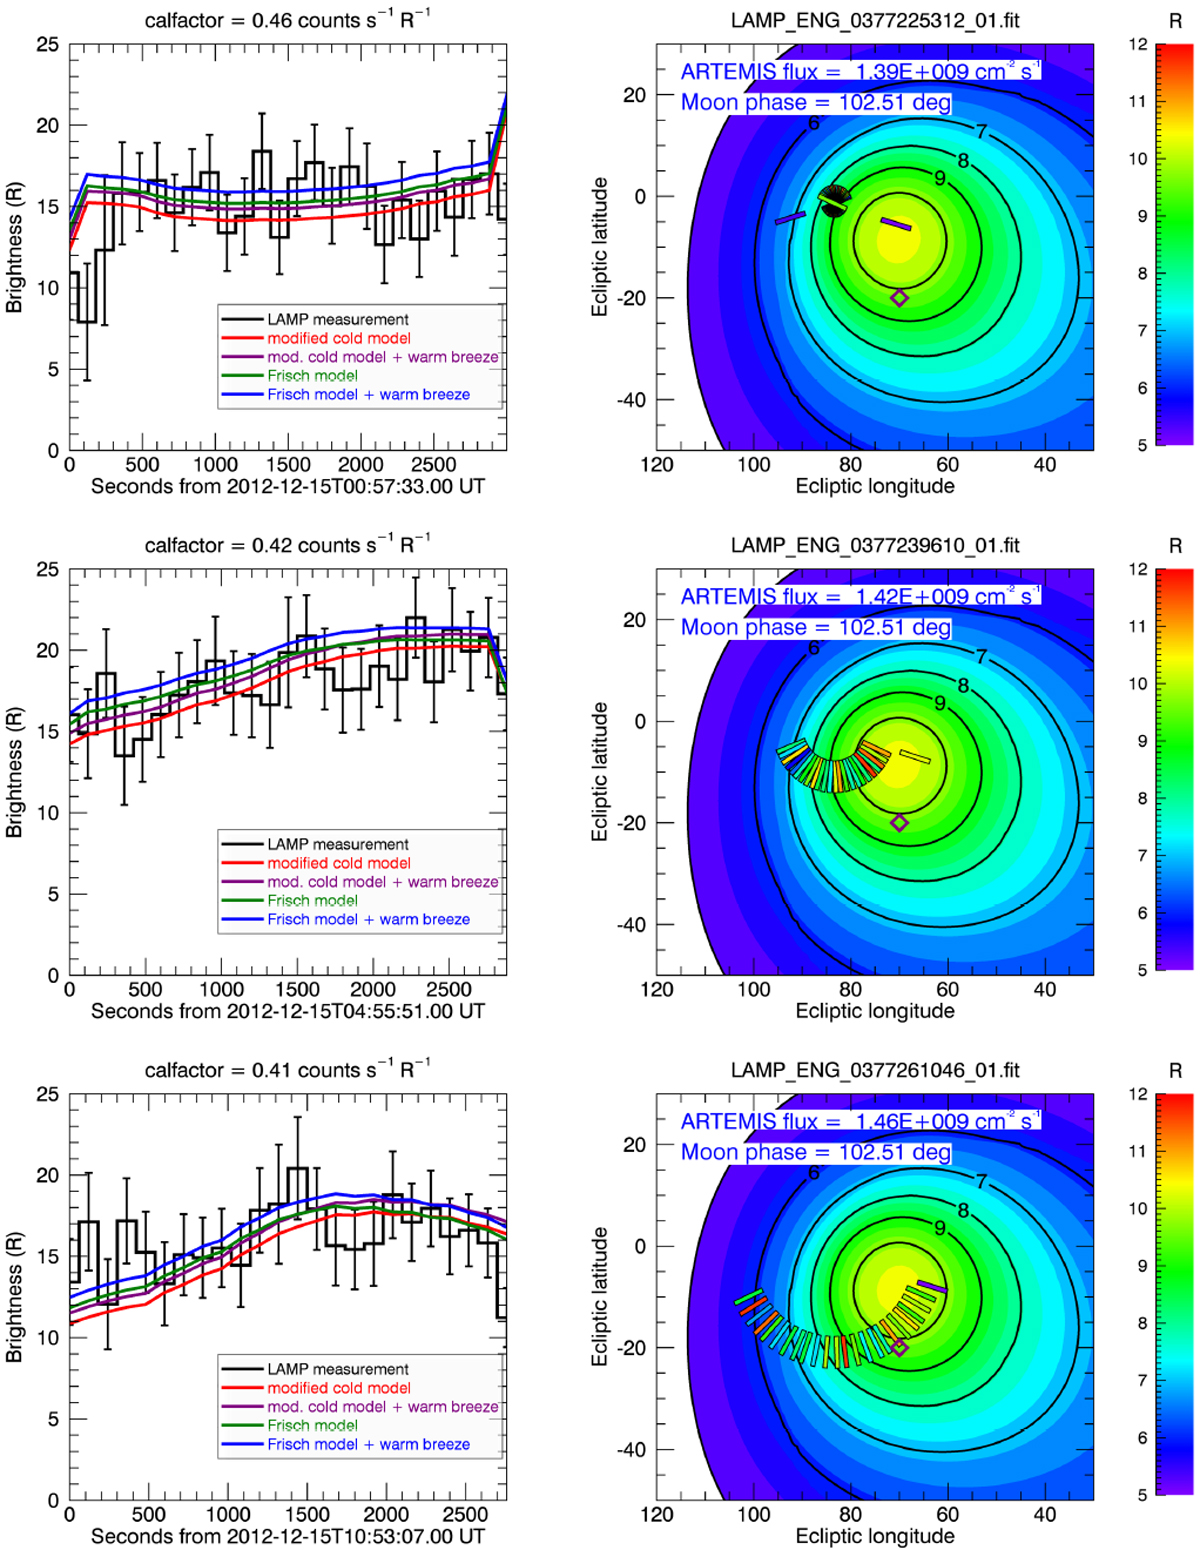
Left panel: light curves comparing LAMP calibrated measurements (black histograms) and the various models (colored lines), with inclusion of our best estimate of lunar exospheric helium foreground emission, for observations on 2012-12-15. Error bars are 3σ values. Right panel: contour plots of our “modified cold model” and LAMP’s slit field of view (whose width is enlarged by a factor of 3), color-coded by brightness (in Rayleighs) with the same color bar as the contour plot. The lunar exospheric helium brightness has been subtracted from LAMP brightness for direct comparison with the underlying contour plot of the model. For the unusual pointing of the first observation (slit almost fixed in the sky), the slits often overlap with each other; therefore, it’s impossible to associate each slit to the light curve on the left panel. The purple diamond is the downwind location of the “warm breeze” (Kubiak et al. 2016).
Current usage metrics show cumulative count of Article Views (full-text article views including HTML views, PDF and ePub downloads, according to the available data) and Abstracts Views on Vision4Press platform.
Data correspond to usage on the plateform after 2015. The current usage metrics is available 48-96 hours after online publication and is updated daily on week days.
Initial download of the metrics may take a while.