Free Access
Fig. 4
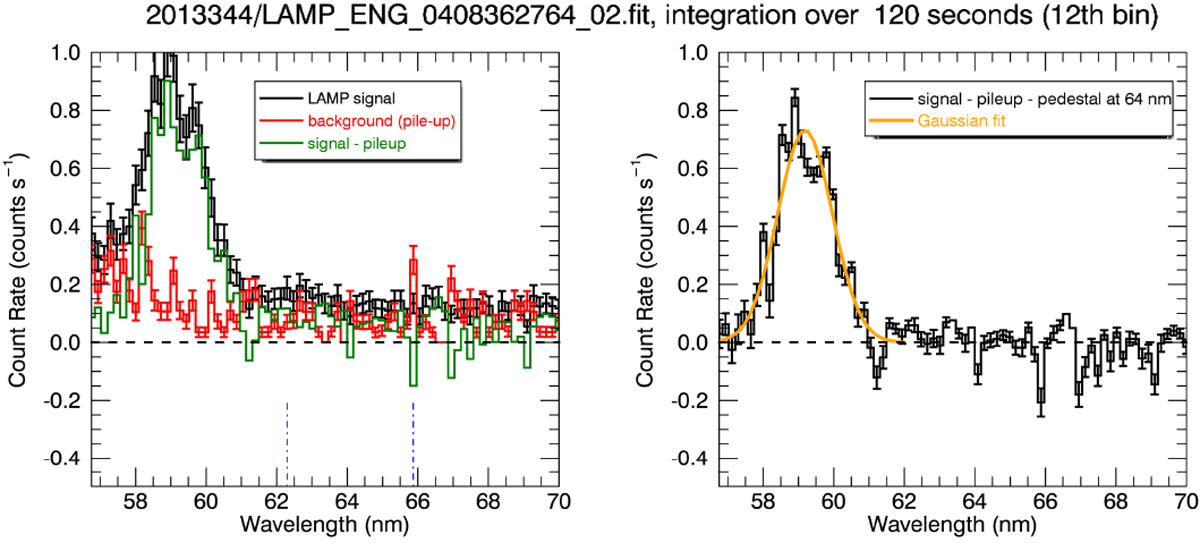
Left panel: spectrum of sky observation (black), the pileup noise (red), and their difference (green). Right panel: the “scaled difference” (i.e. the green line in the left plot minus its average within the blue vertical lines) and its Gaussian fit (orange line).
Current usage metrics show cumulative count of Article Views (full-text article views including HTML views, PDF and ePub downloads, according to the available data) and Abstracts Views on Vision4Press platform.
Data correspond to usage on the plateform after 2015. The current usage metrics is available 48-96 hours after online publication and is updated daily on week days.
Initial download of the metrics may take a while.